5.20 Phase Analysis QUANTAX EDS
109
The AutoPhase tool calculates images that reveal the local distribution of different phases in a
sample.
acquire a map or open a bcf.
Refer to section 5.17. Phase analyses can be
performed on qualitative and quantitative
maps.
tab and the elements of
interest for phas
Select elements by ticking the boxes below
the individual element images in the
thumbnail bar. Only selected elements will be
used for phase calculation.
Automatic update is useful when
experimenting with methods and parameters.
T
he phase image will update after every
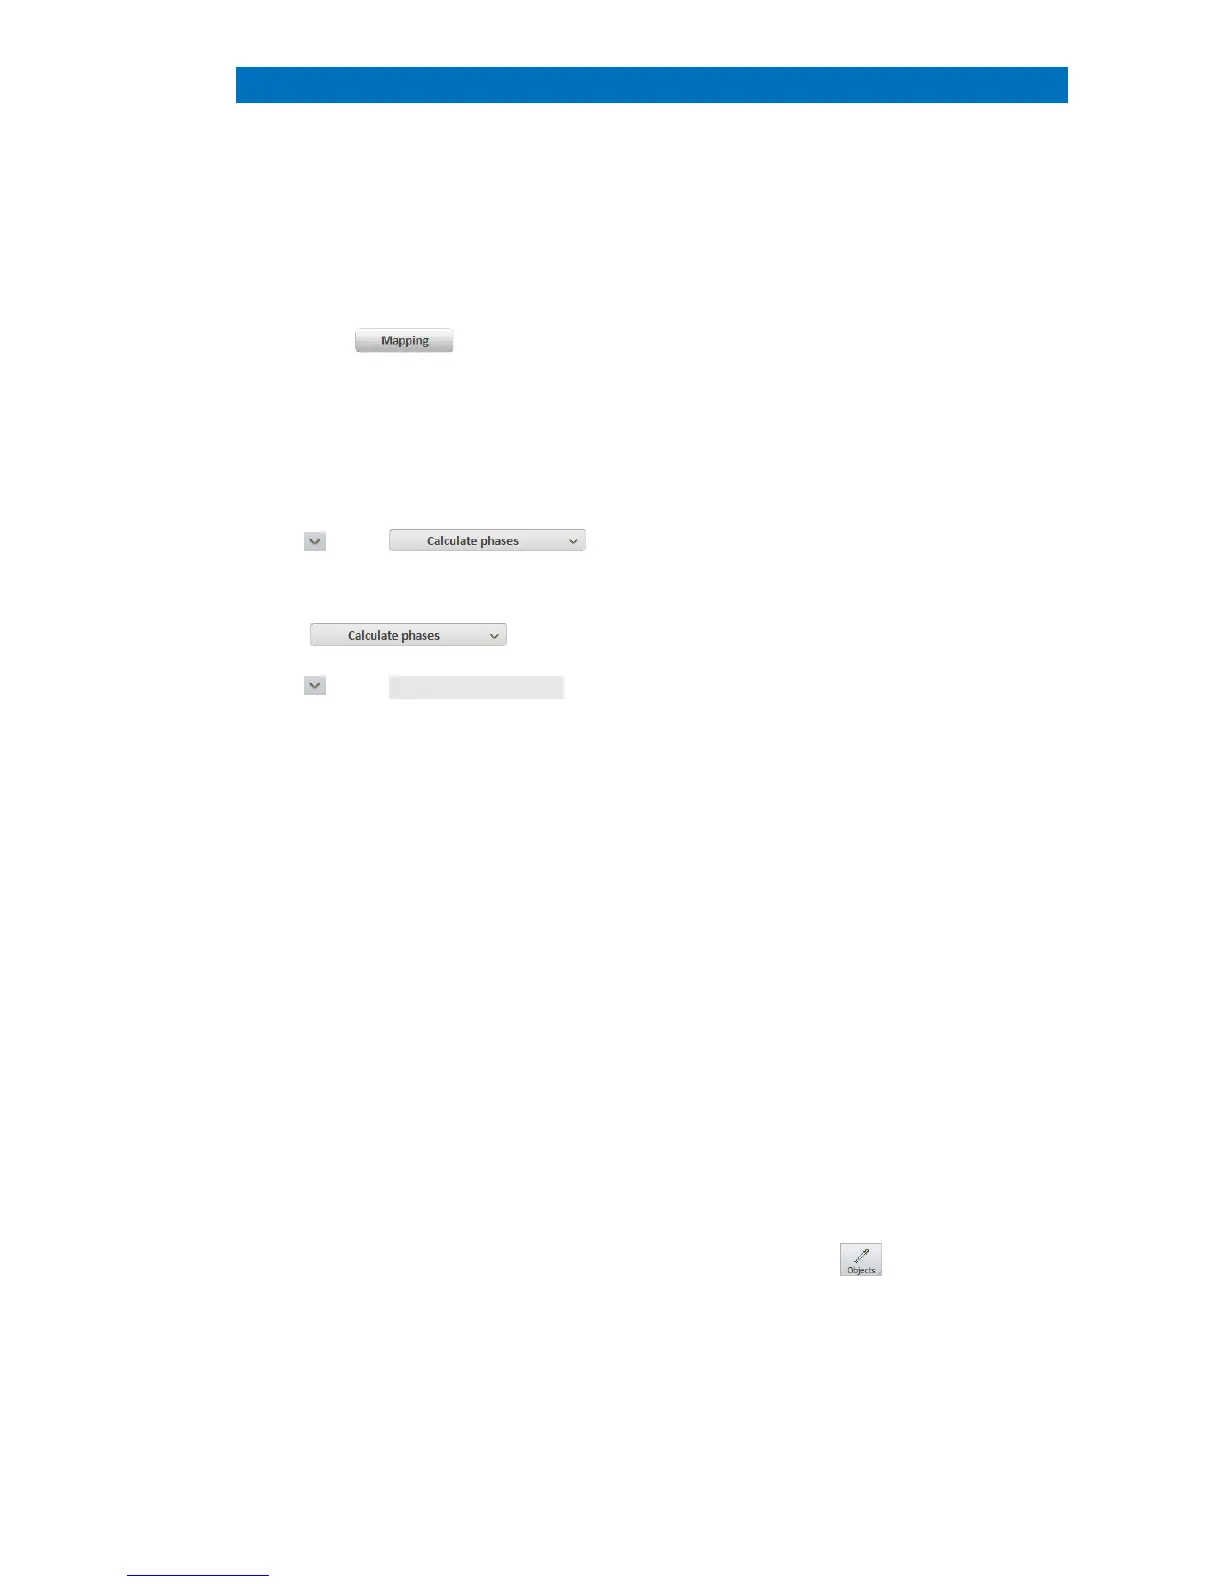
Phases will be calculated and appear in the
thumbnail bar.
Use on the AutoPhase settings sub-
menu to open it.
Set parameters for phase determination.
Select the AutoPhase Method
All three AutoPhase methods work based on
the number of element
ixels containing the same
al information represent a particular
phase. Depending on the chosen sensitivity,
pixel
s with similar composition get merged
PCA (Principal Component Analysis) is a
specific type of vector analysis reducing the
dataset to the most r
information. It starts its operation with an n
dimensional “element” space. The intensity
of every element selected in the map
thumbnail bar (below the left
one axis of this space. Map pixels
form data clouds which are separated by the
PCA dimension reduction algorithm.
The Cluster method compares the
composition of neighboring pixels (by running
through the map pixel by pixel).
The phases are user-defined by manually
d
efining objects using drawing tools
accessible through the icon.
Select and adjust the Options for the
phase calculation
Use the sliders to change the values.
 Loading...