User Manual 5 Step-by-Step Guides
98
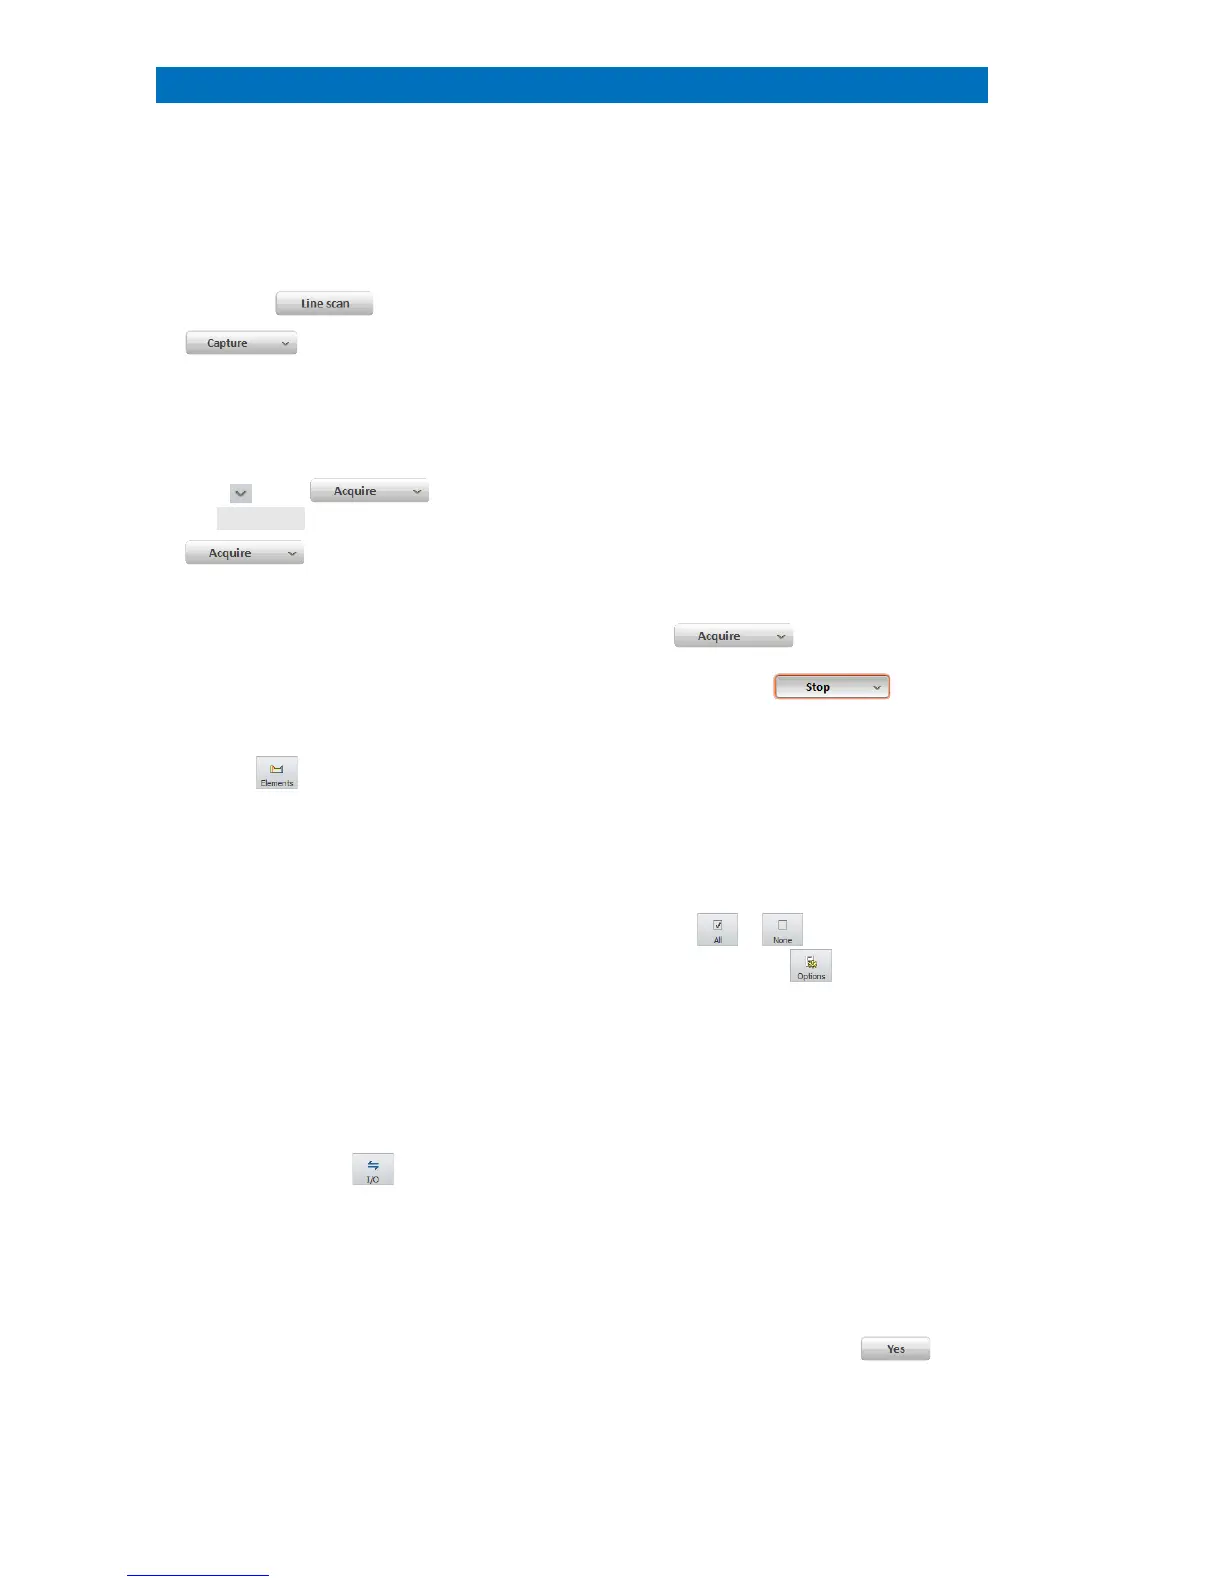
This section describes the steps of line scan analysis using the Line scan workspace.
Highlight the line and drag and adjust the
endpoints to the desired position.
Set Point count of the line scan.
Alternatively select Distance [µm] between
measurement points.
The line scan is automatically terminated if
Automatic
or Measurement time [s] is
acquisition can be stopped manually by
clicking
lick
terminates scan after finishing the last scan
(the button changes
icon to identify elements.
Elements are automatically identified by Auto
ID
. Add and delete elements by clicking on
Element ID or use the Finder in the
displayed in the line profile thumbnail bar.
The element selection can be changed at any
time during or after the line scan acquisition.
Select elements in the thumbnail bar by
ticking the boxes below the individual
element images
to display their profiles
the line profile display settings, e.g. scaling of
the x
-axis, selection of result types, filter
strength, etc. (see also Fig. 5.16-1).
Use right mouse key in the scan image
to extract region of interest spectrum
from the line scan
Extracted spectrum (named as Range)
appears in the
Spectrum tab. (optional step).
Scan spectrum in the spectrum tab
presents the sum spectrum of the line.
Use the workspace icon to
Use .rtl file format to save line scan data
including
EM and scan images and point
Image(s), composite element profiles and
scan image will be transferred.
Do you want to
save point spectra too?
to transfer spectral data.
 Loading...