5.17 Map Acquisition QUANTAX EDS
103
Use the thumbnail bar icon to
Individual element images of selected
thumbnails
will be saved. To select them
mark the individual element images with left
mouse-click + SHIFT or CRTL key.
Composite and individual element images will
be added to Project
Individual element images will be added to
Report
. Alternatively, click with the right
mouse button into the thumbnail bar.
Process Map data as desired.
Refer to section 5.19. For quantitative
mapping see section
*optional, license-based
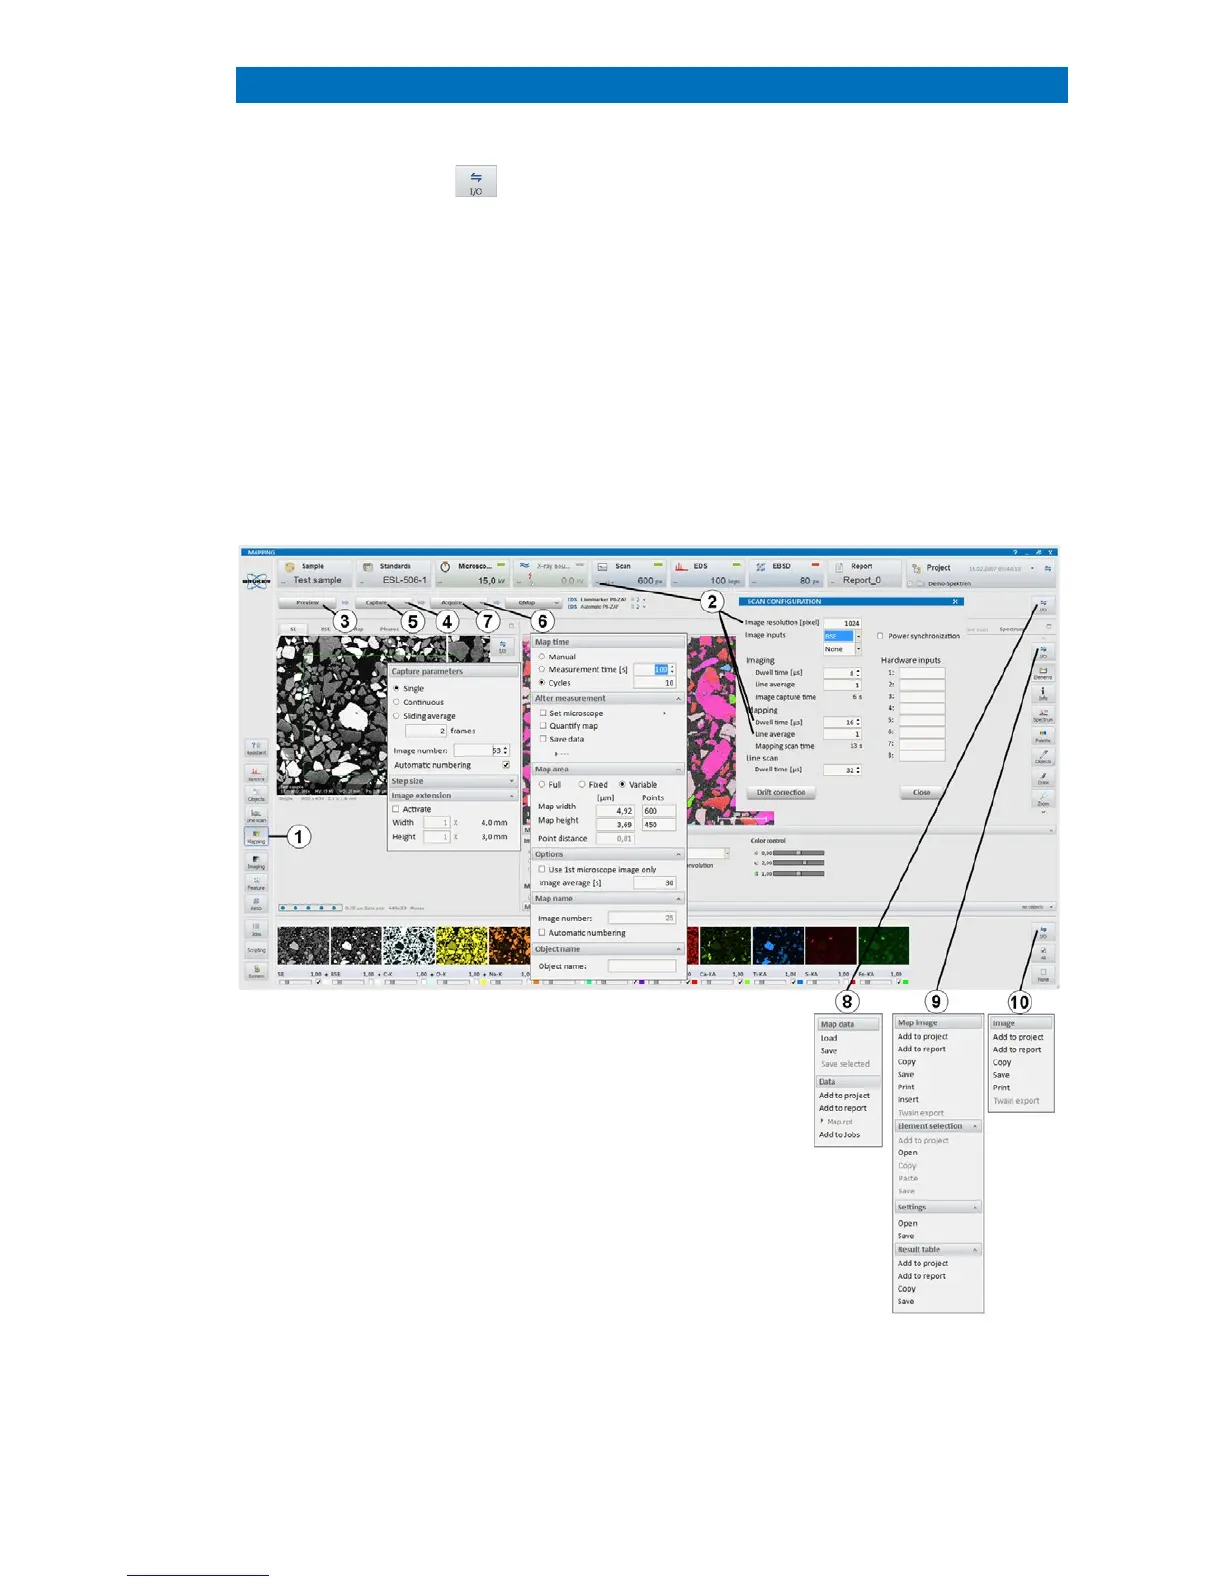
Fig. 5.17-1 Map acquisition
 Loading...