50 5 Screen List
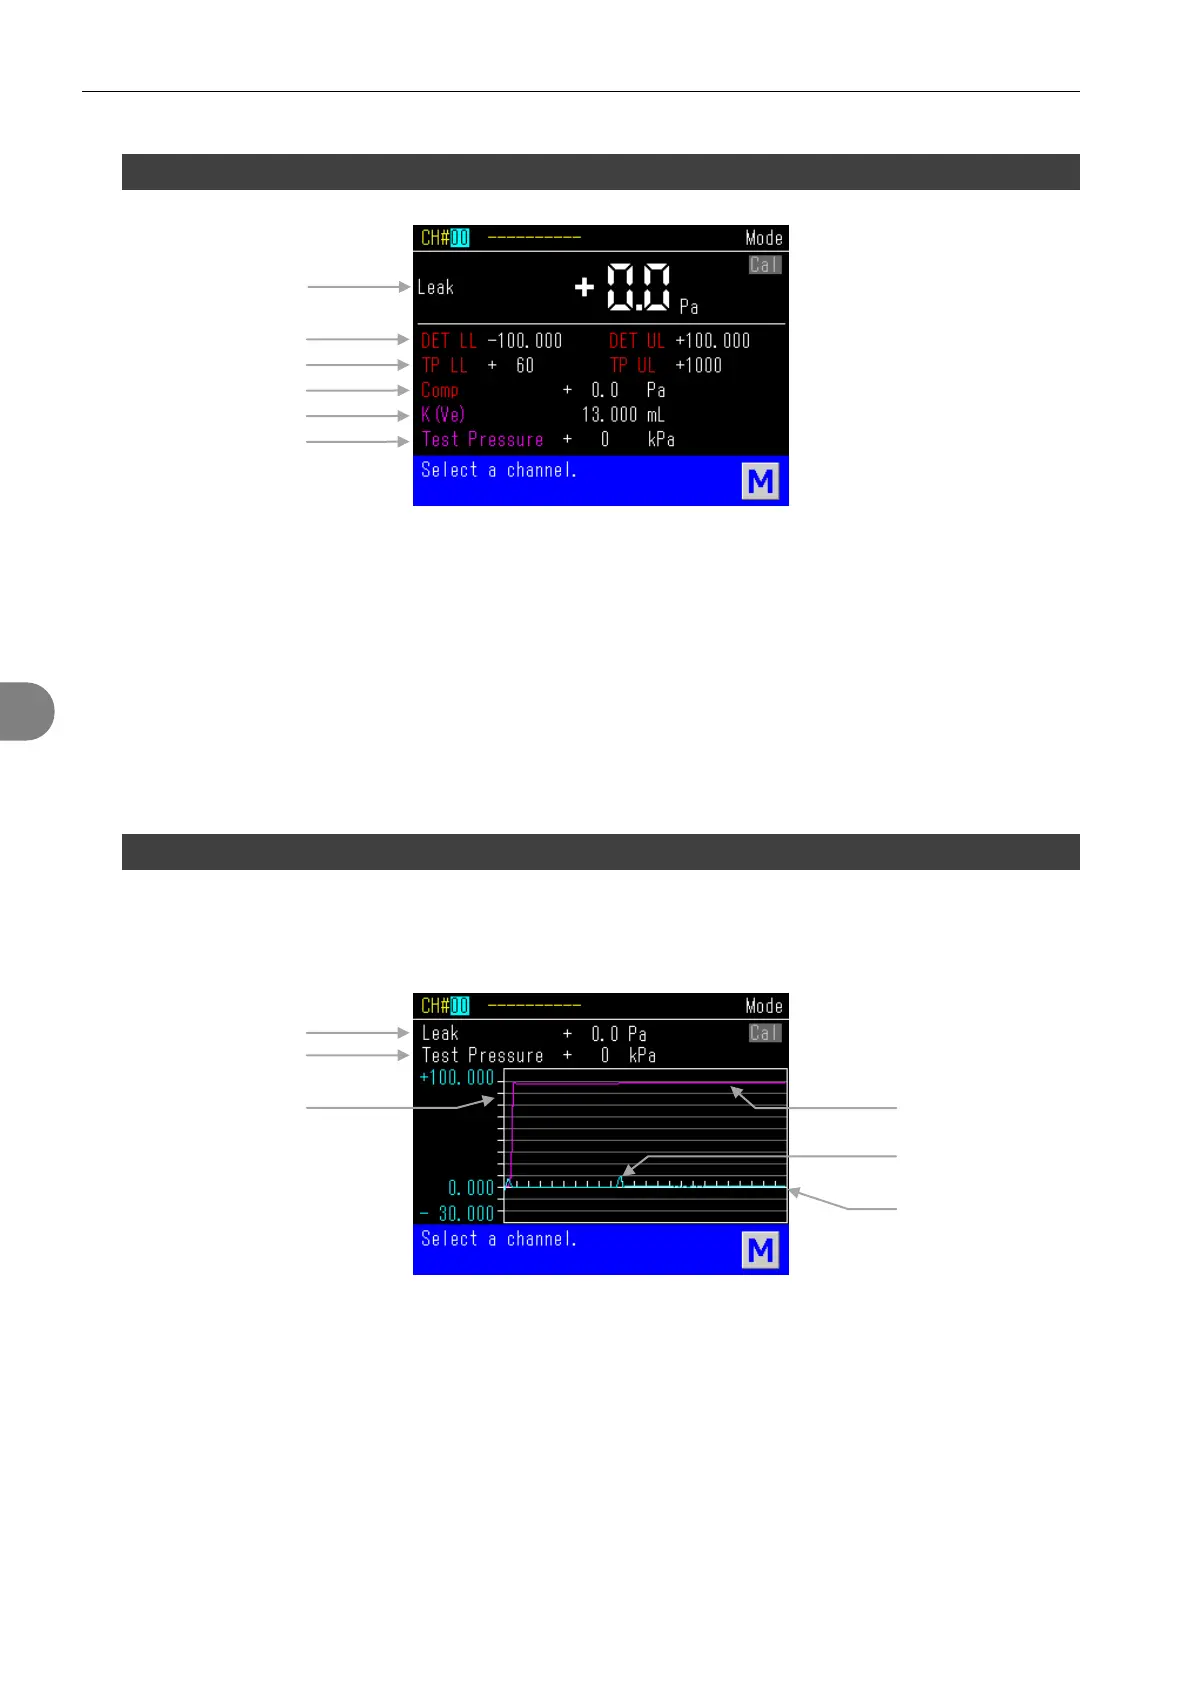
2.3 Measurement Screen Description: Advanced (Manual)
A Leak: Leak in a selected unit
B TP LL / TP UL:
Upper and lower limits for test pressure
C DET LL / DET UL:
Upper and lower limits for leak in Detection
stage.
D Comp: Current compensation value
E K(Ve): The current K(Ve) value
F Test Pressure: Test pressure in a selected unit
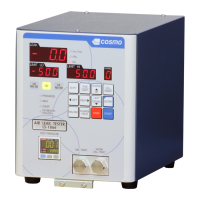
2.4 Measurement Screen Description: Waveform (Manual)
Applied test pressure and measured Leak are displayed in graphs.
The blue line indicates Test Pressure and the pink line indicates Leak.
A Leak: Leak in a selected unit
B Test Pressure: Test pressure in a selected unit
C Y axis: DET UL is the full-scale of the Y axis.
Although the scale for the test pressure is not
displayed, the full-scale of the test pressure is its
upper limit as well.
D Test Pressure Graph:
The graph of the Test Pressure (Pink)
E Leak Graph: The graph of the Leak (Blue)
F X axis: Test time