Clinical Studies
B-2 Operator's Manual
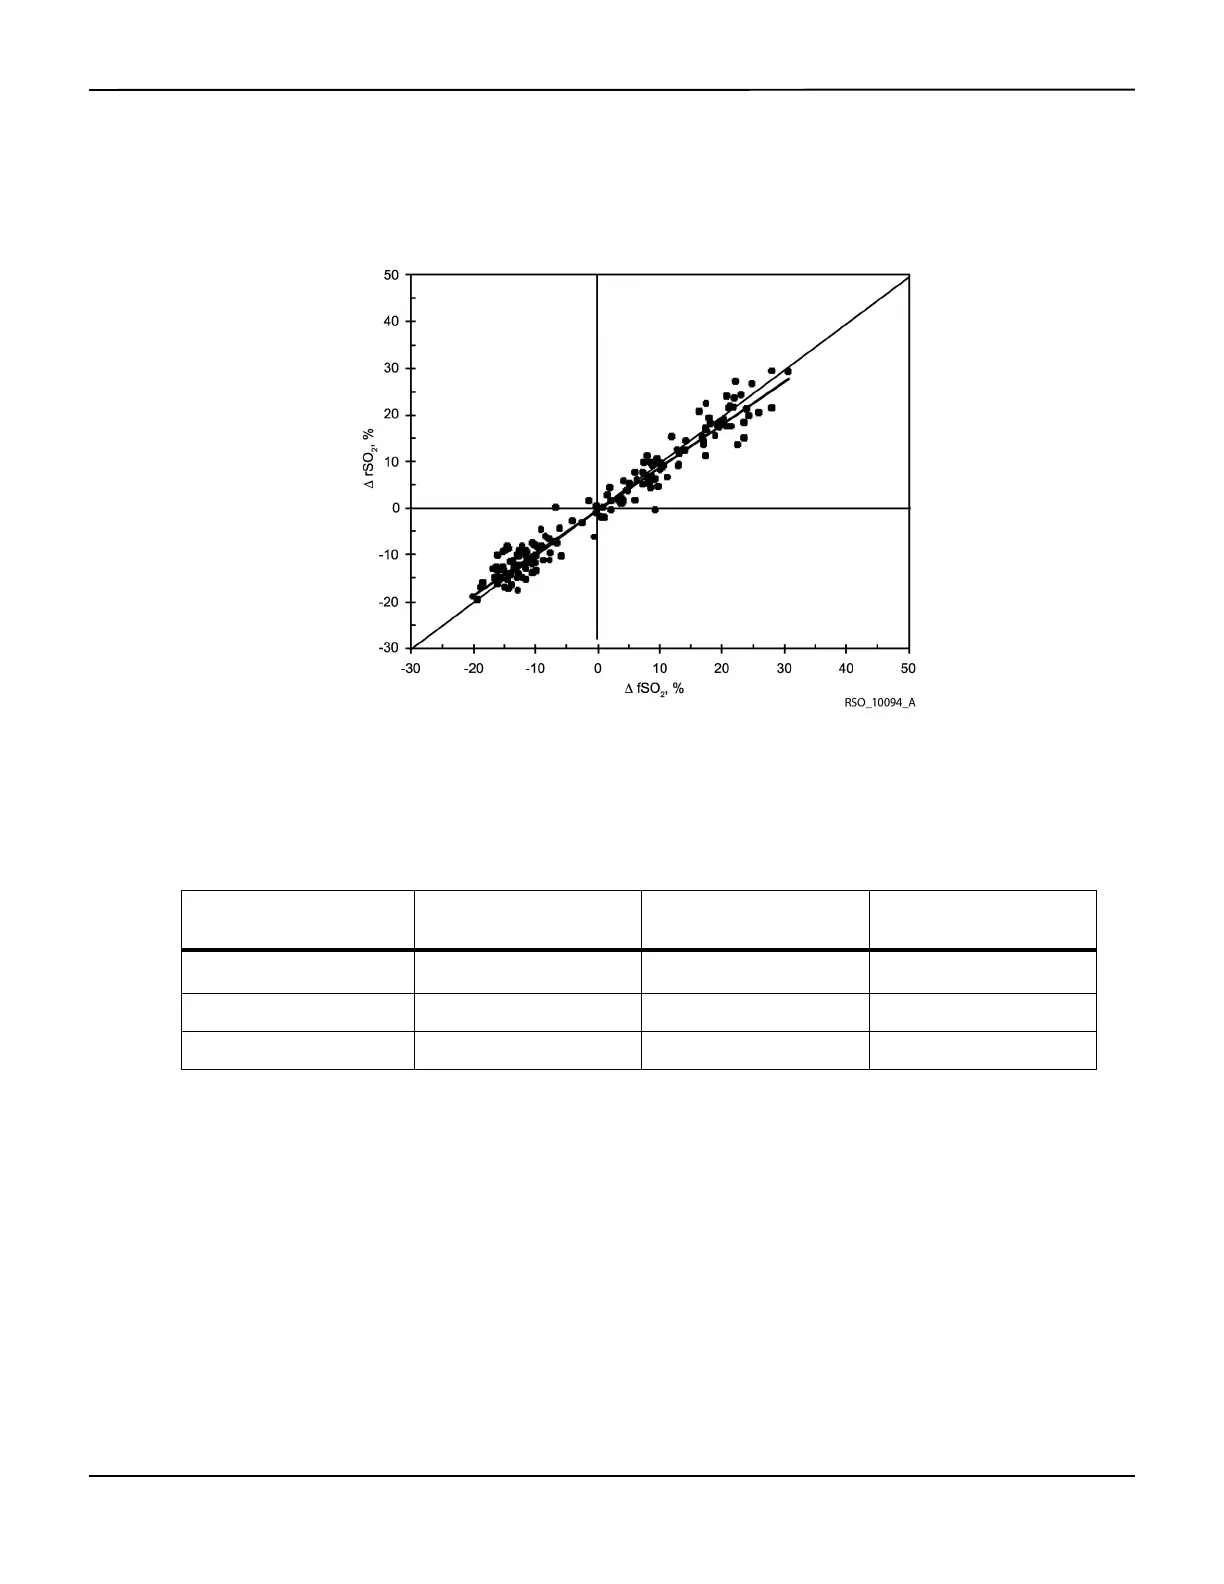
Results:
FigureB-1.rSO
2
and fSO
2
, 20 Subjects
One subject had a bias value of 37.2%, which corresponded with a very low signal quality index
number (SQI=1). The remaining 41 subjects had SQIs that started at 10 and remained greater than
four throughout the study.
Subject 206’s absolute bias data was excluded from the analysis due to the low signal quality, but
the trend data was left in as trending is not dependent on SQI.
Transitions 96 and 97 data; last 20 subjects; 179 data points. y=0.9133x–0.1755;
R
2
=0.9575; bias=0.26; standard deviation=2.9.
TableB-1.Bias, Error, and Correlation for rSO
2
and fSO
2
Individual subjects (N=20)
mean
Range Pooled (N=180) transi-
tions
Difference
1
(Bias)%
1. Less subject 206
2.49 –6.47 to +11.78 0.26
Error (standard deviation)% 2.13 0.85 to 4.22 2.90
Correlation (r2) 0.947 0.823 to 0.990 0.958