Run Function (Patient Monitoring) in Normal Mode
Operator's Manual 6-33
6.5.15 Time Scale
The trend graph time scale may be adjusted in the Time scale menu or the User configuration
menu. To change the hours viewed (x-scale) of rSO
2
values plotted on the trend data graph, adjust
the time scale.
To adjust the time scale without having to use the User configuration menu, press the HOME
key to display the Main screen, then perform the following navigation bar options:
Select the INCREASE and DECREASE options to adjust the time scale. The time scale range
options are: 1, 2, 4, 8, 12 and 24 hours. The default time scale is 1 hour.
When finished, select MAIN MENU or press the HOME key and return to the Main screen. On
the Main screen, the time scale limit is numerically displayed.
6.5.16 Real-Time Review
Real-time review allows the operator to review the most recent 24 hours of stored data trends and
event marks on the monitor. The data may be displayed in graphical (trend data graph) or tabular
trend screen format. The stored trending rate is two per minute.
In Real-time review—tabular trends, approximately 28 hours of data will be temporarily stored
until the unit is turned off. When the case memory is full, the oldest line of data will be deleted to
make room for newer line of data.
Real-Time Review—Graphical Format
Note:
More than 1 hour of data must be stored to activate trend graph review. Data can only be reviewed in 1
hour increments.
Note:
Alarm messages, channel identification, and rSO
2
area elements will continue to be displayed while in Real-
time review.
To use Real-time review in graphical format, press the HOME key to display the Main screen,
then perform the following navigation bar options:
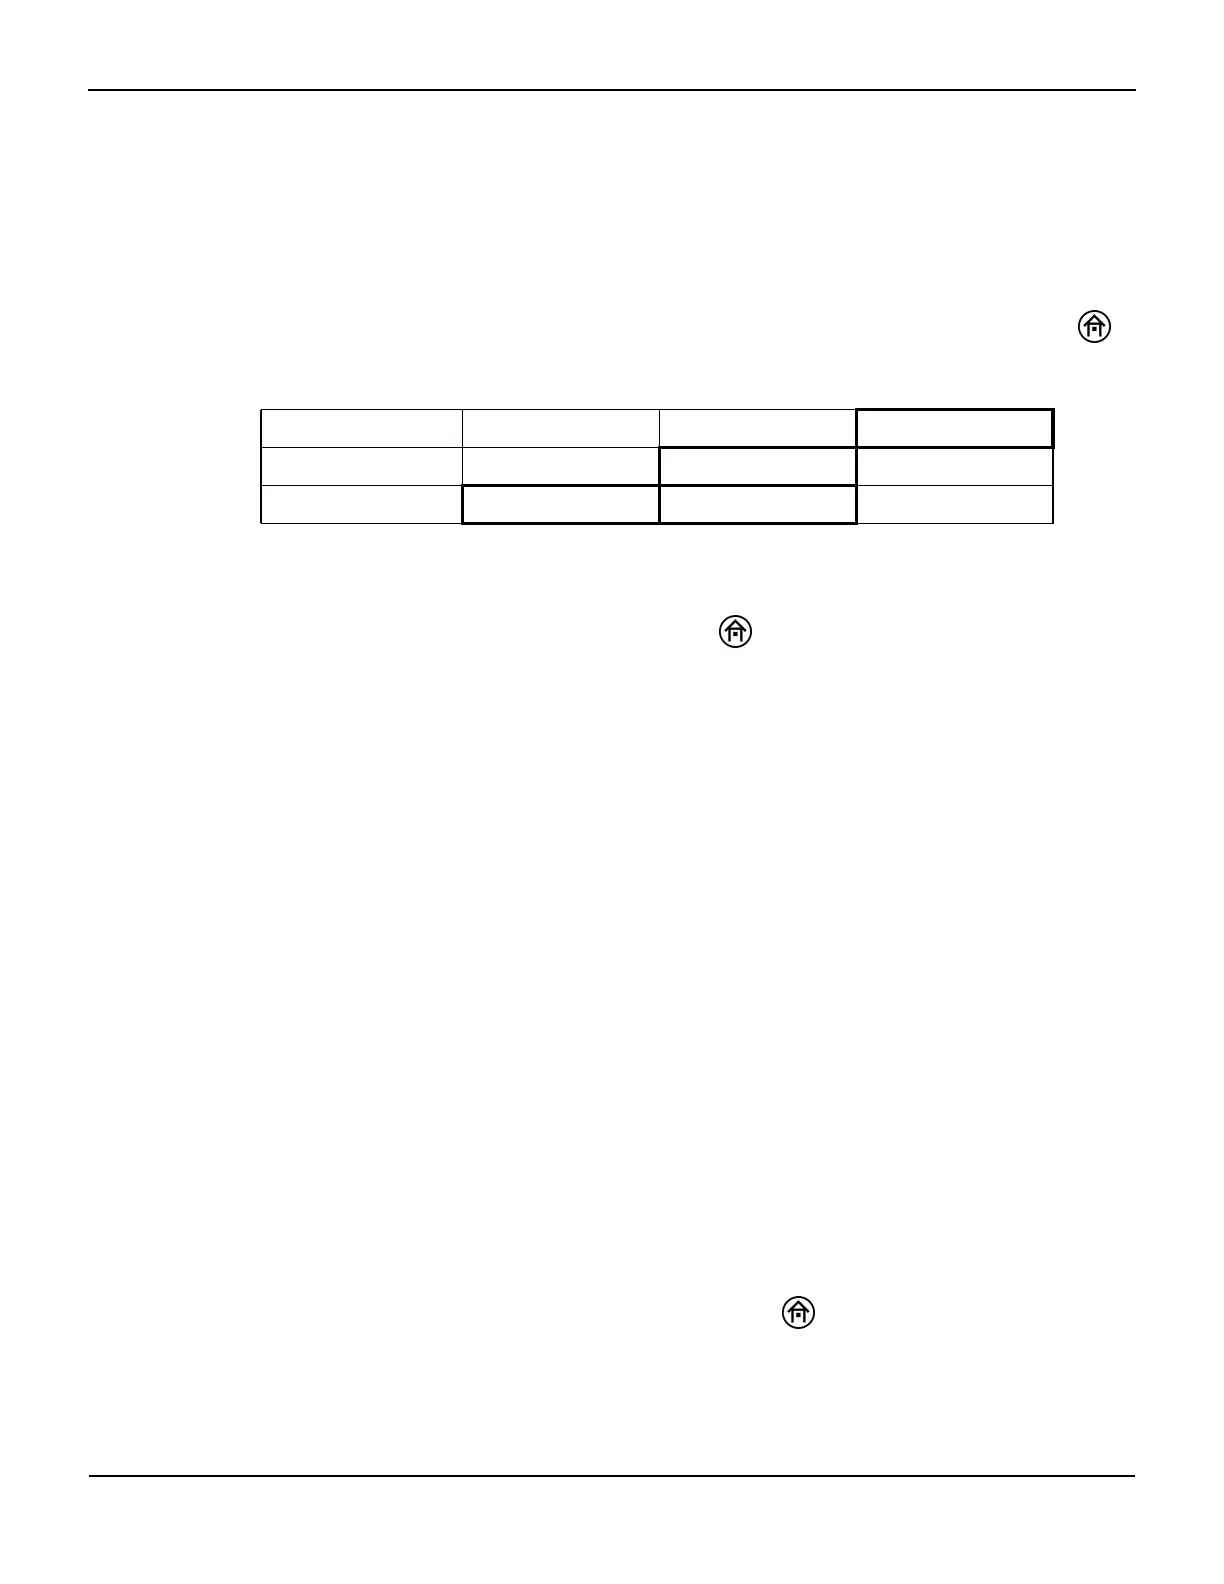
BASELINE MENU EVENT MARK ALARM AUDIO ON/OFF NEXT MENU
OUTPUT SELECT USER CONFIGURATION TIME SCALE NEXT MENU
SCALE HOURS = XX INCREASE DECREASE MAIN MENU
 Loading...