Implementing and Handling Applications
▲
■■■■■■■■■■■■■■■■■■■■■■■■■■■■■■■■■■■■■■■■■■■■■■■■■■■■■■■■■■■■■■■■■■■■■■■
DS1103 Hardware Installation and Configuration March 2004
I■■■■■■■■■■■■■
▼
132
■■■■■■■■■■■■■■■▼
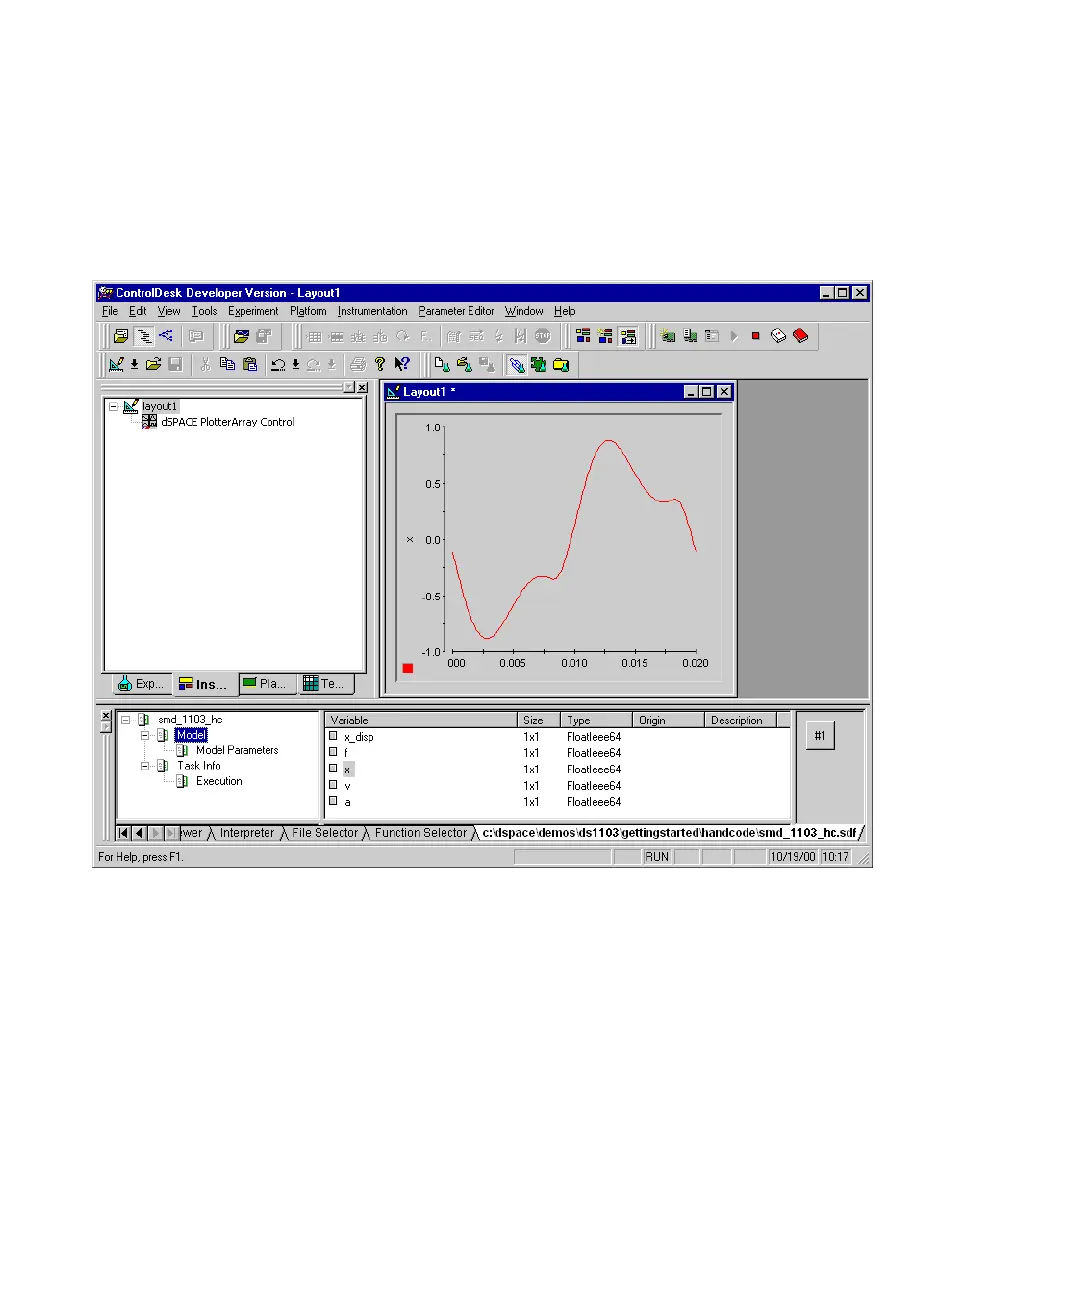
9 From the menu bar, choose Instrumentation – Animation mode
to start the animation. In the following example there is one
plotter to display the signal x.
10 To add new instruments to the layout or to change the properties
of existing instruments, choose Instrumentation – Edit Mode.
11 From the menu bar, choose File – Save to save the new layout.
Data connections describe the connection between variables of the
real-time application and a ControlDesk instrument. To save data
connections, you should create an experiment and add the layout to it.
For further information, refer to Saving and Loading Instrument Panels
in the ControlDesk Experiment Guide.
 Loading...