4.4 Viewing Harmonic Measurement Values
72
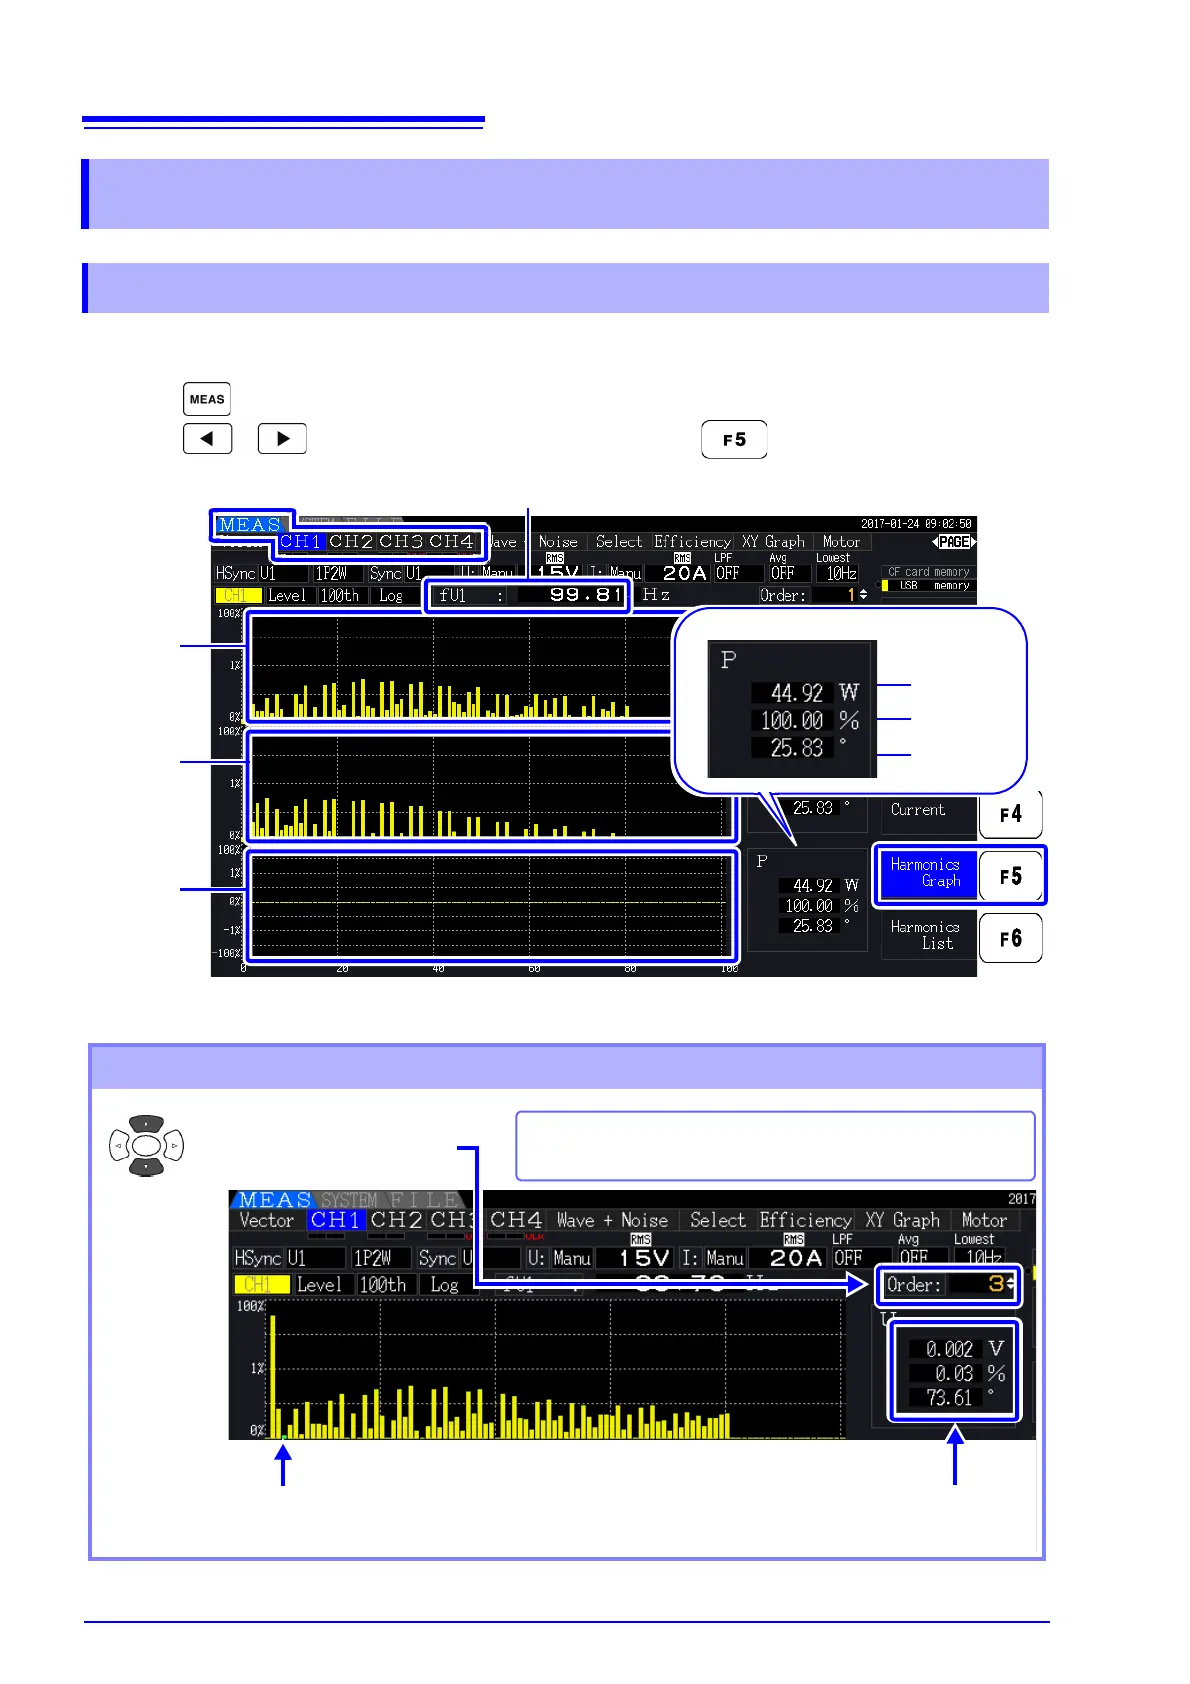
The results of harmonic analysis of voltage, current and active power on the same channel can be dis-
played as a bar graph. Numerical data for the cursor-selected order is also displayed.
Press to display the Measurement screen.
Press to select the desired [CH] page, and press .
4.4 Viewing Harmonic Measurement Values
4.4.1 Displaying the Harmonic Bar Graph
Harmonic
Voltage
Harmonic
Current
Harmonic
Active
Power
Amplitude
Content (%)
Phase Angle
Harmonic Sync Source Frequency
Changing the Displayed Order
Change the selected order.
The green bar indicates the selected order.
These selections correspond to the orders on the
Harmonic Vector screen.
Shows the measured values of the
cursor-selected order.