4.6 Viewing Noise Measurement Values (FFT Function)
83
4
Chapter 4 Viewing Measurement Values
Perform FFT analysis on a selected channel's voltage and current to display noise up to 200 kHz as a
graph and as numerical values. This function is convenient for monitoring an inverter's carrier frequency,
harmonic noise ingress on commercial power lines, or DC power.
For more information about how to change the function’s settings, see "4.6.2 Setting the Sampling Fre-
quency and Points" (p. 85).
The numerical noise values can be saved to storage media.
See "7.5.3 Selecting Measurement Items to Save" (p. 143)
(Select [Other] with the key and set the noise peak value.)
Noise voltage and current can be displayed in separate graphs along with numerical values.
Numerical noise voltage and current values at ten frequencies are displayed in order of decreasing amplitude.
4.6 Viewing Noise Measurement Values
(FFT Function)
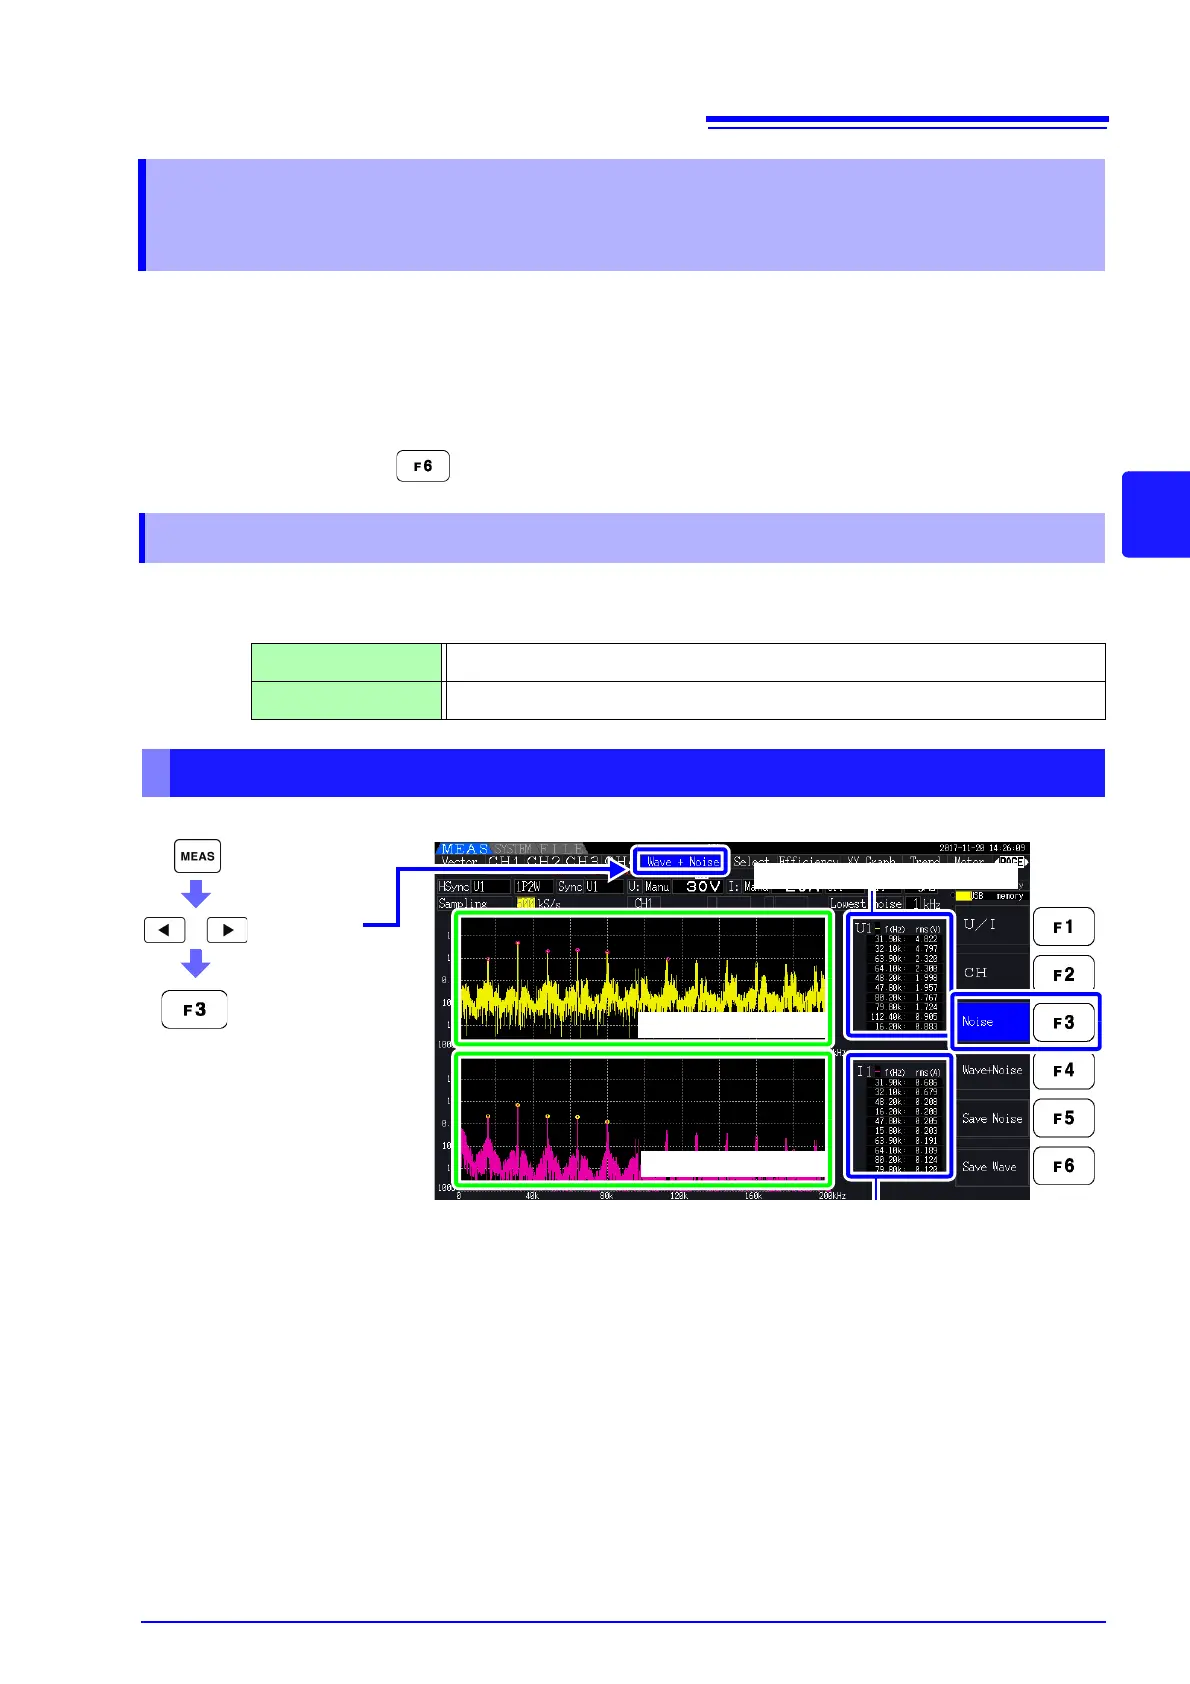
4.6.1 Displaying Noise Voltage and Current
Horizontal Axis Linear frequency scale
Vertical Axis Logarithmic noise amplitude scale
Displaying Noise
Select [Noise]
Display the
[
Wave + Noise]
page
Noise Voltage Graph
Noise Current Graph
Noise Voltage Numerical Value
Noise Current Numerical Value