ThinPrep™ 5000 System Instructions for Use English AW-22289-001 Rev. 003 11-2021 28/36
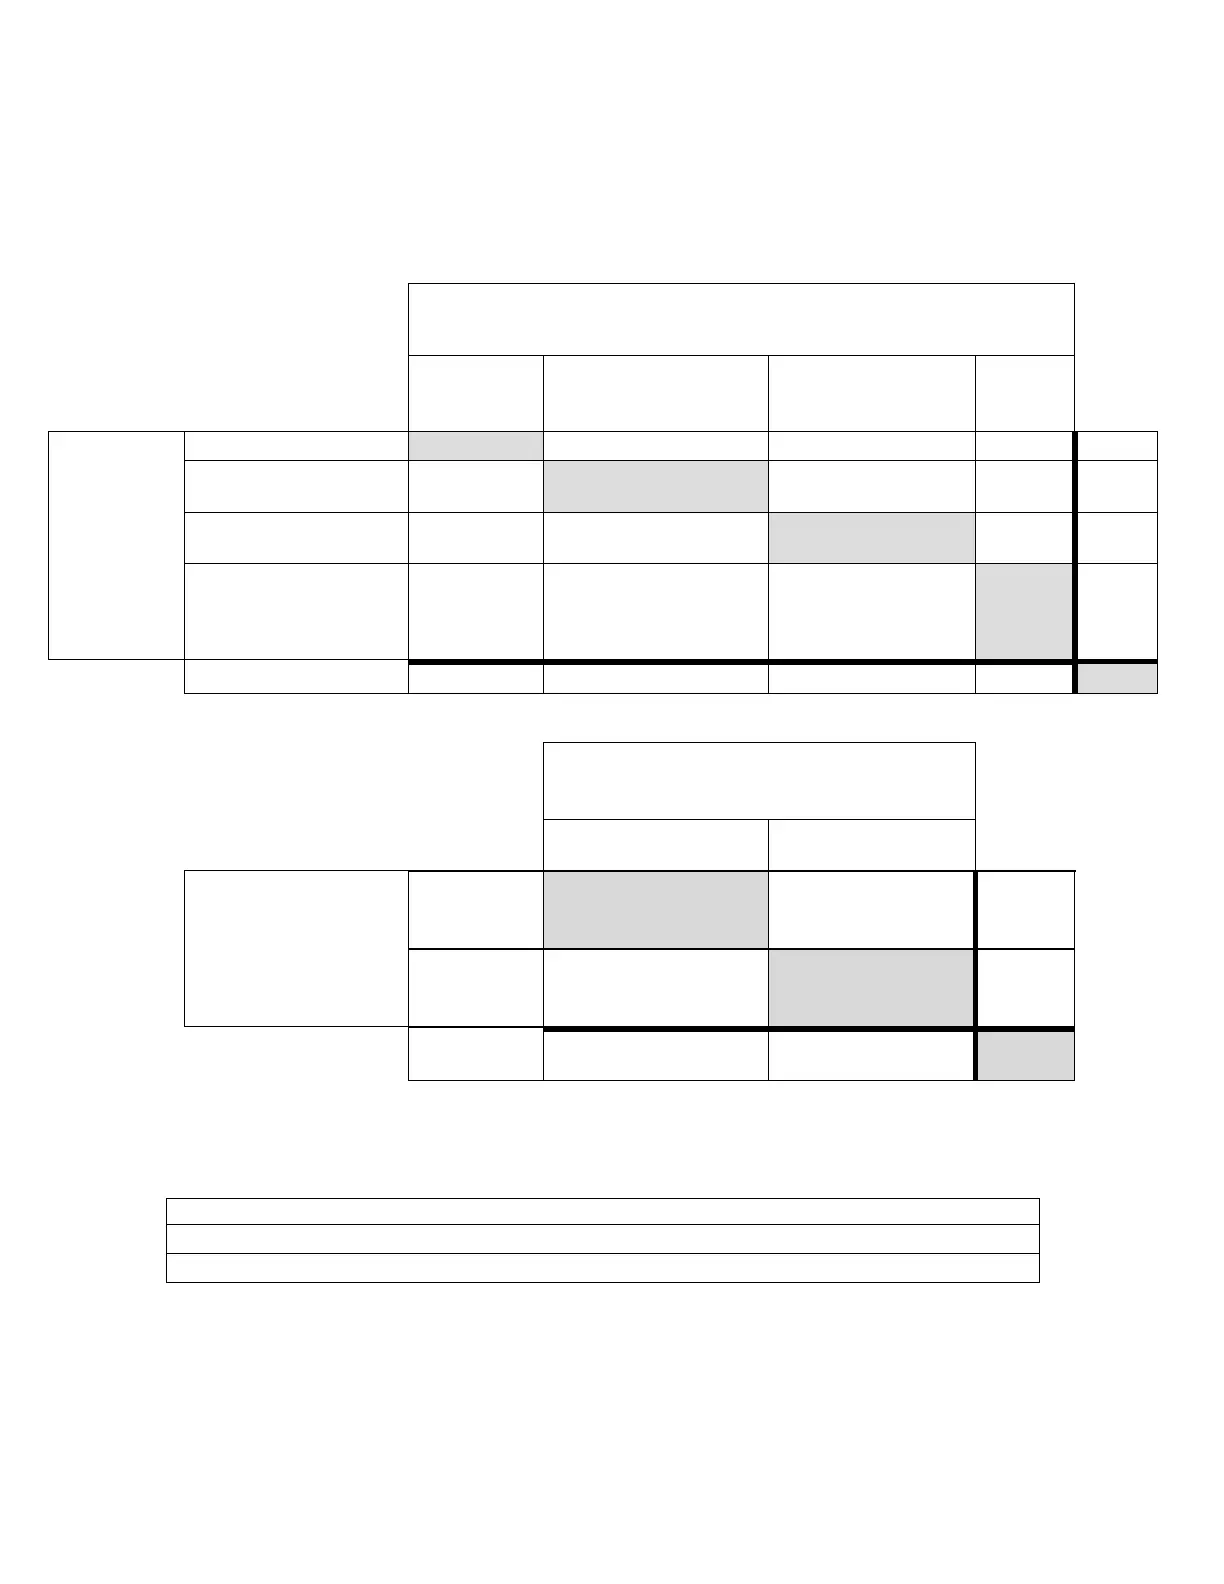
In Table 26 for ASCUS+, the number of specimens is shown for which various levels of agreement
among the CTs occurred. Either all three CTs rated the slide as positive (ASCUS+), two out of
three rated it positive, one out of three, or none of them.
Table 26: CT Agreement, All Results, ASCUS+
ThinPrep 2000 System
Three lab CTs have read the same ThinPrep 2000 slide from a vial
ASCUS+
Three CTs
had ASC-H+
Two CTs had ASCUS+ &
one had <ASCUS
One CT had ASCUS+
& two had <ASCUS
Three
CTs had
<ASCUS
Totals
ThinPrep
5000
Processor
Three lab CTs
have read the
same
ThinPrep
5000 slide
from a vial
Three CTs had ASCUS+
393 36 8 4 441
Two CTs had ASCUS+
and one had <ASCUS
31 24 13 10 78
One CT had ASCUS+
and two had <ASCUS
11 8 34 53 106
Three CTs had <ASCUS
3 13 56 563 635
Totals
438 81 111 630 1260
ThinPrep 2000 System
Three lab CTs have read the same
ThinPrep 2000 slide from a vial
ASCUS+
Three or two CTs had
ASCUS
Three or two CTs had
<ASCUS
Totals
ThinPrep 5000
Processor
Three lab CTs have read
the same ThinPrep 5000
slide from a vial
Three or two
CTs had
ASCUS+
484 35 519
Three or two
CTs had
<ASCUS
35 706 741
Totals
519 741 1260
Table 27: Rate of CT/Pathologist Agreement, ASCUS+
ASCUS+
PPA 93.3% (484/519) (90.8% to 95.1%)
NPA
95.3%
(706/741)
(93.5% to 96.6%)
The rate of agreement between the ThinPrep 5000 result and the ThinPrep 2000 result from the
previous table is presented below. PPA is the positive percent agreement, percent of specimens
of ASC-US+ diagnosis with ThinPrep 5000 slides by a majority of laboratory CT/Pathologists