ThinPrep™ 5000 System Instructions for Use English AW-22289-001 Rev. 003 11-2021 31/36
5000 system, then stained and coverslipped. All slides were run on a ThinPrep Imaging System
to obtain Imager object count data, which has been demonstrated to correlate closely with
cytotechnologist cell count estimates. Cellularity varies among clinical specimens, so a range of
cell counts was obtained.
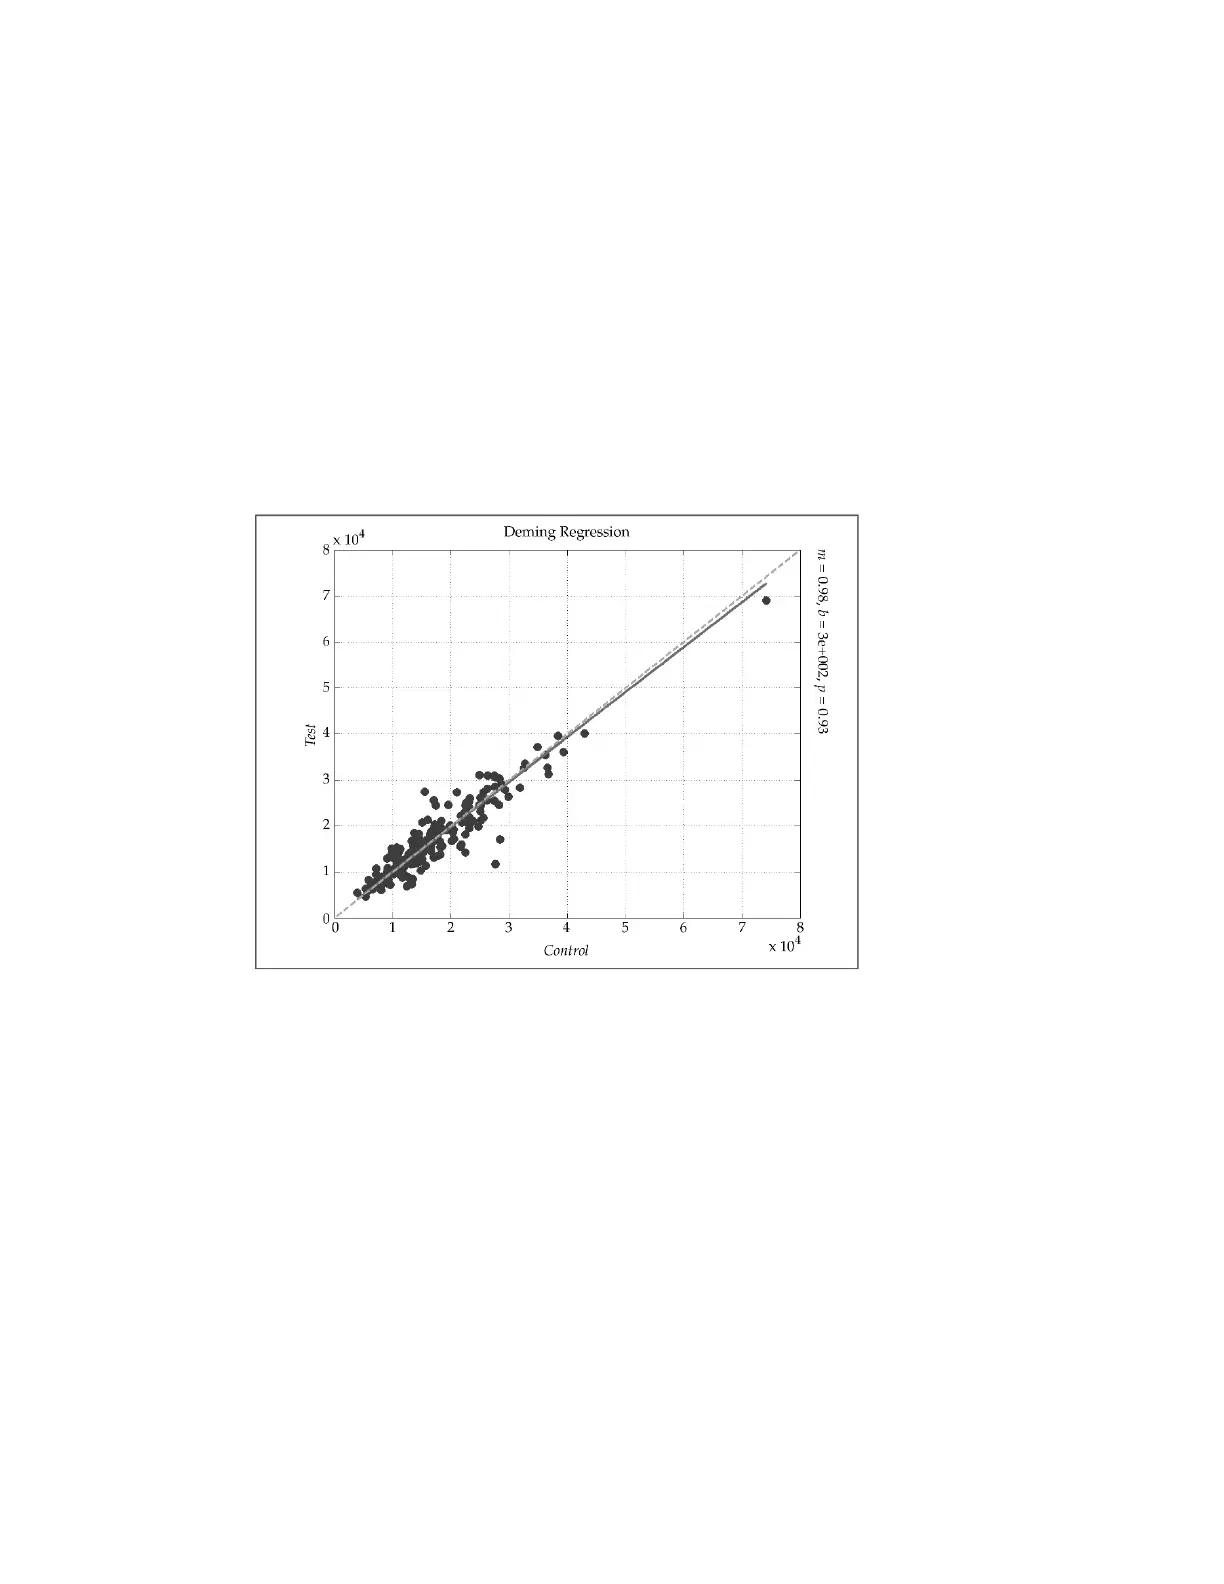
The chart below provides a scatter plot of the count data from the matched pairs of slides in this
study. The Control axis is the ThinPrep 2000 slide’s count value, and the Test axis is the
matching ThinPrep 5000 slide’s count.
Deming regression analysis was performed and the slope was 0.98 with 95% CI: 0.94 to 1.01 and
the intercept was 300 with 95% CI: -300 to 897. The data demonstrate similar cell count values
on the ThinPrep 2000 and ThinPrep 5000 slides.
Cellular Carry-Over Study
Cellular carry-over between slides was evaluated in a laboratory study, with comparison of the
ThinPrep 5000 and ThinPrep 2000.
On each system, 200 abnormal clinical specimens were processed, alternating with 200 blank
PreservCyt vials containing no cells. After processing, slides made from the blank vials were
segregated from cellular slides, stained and coverslipped, then reviewed by cytotechnologists.