4-20
Echo Graph Depth Range
・Function・ The depth range in the graph is set within the range of 100-500m. Refer to the example ②
in Fig.4.2.2
Range setting value: [100 200 300 500] m
Operation Standard Menu: Current screen setting menu/Echo Graph depth range: 100-500m
Selection Frame Menu: Echo graph setting menu/ Echo Graph depth range: 100-500m
Mode Selection
・Function・ Display mode (*1) in the graph is selected. The standard is an echo mode.
Echo: It converts into the display color based on signal level (*2) of the received echo and
it displays. The display color can be selected from A-D by the menu (*2).
S N: An echo of the S/N value low (It is a lot of noise element) is penetrated, and displayed
by a color near the background color.
The S/N value is displayed in "Cursor position echo" table (*3).
Operation Standard Menu: Current screen setting menu/Mode selection: Echo/SN
Selection Frame Menu: Echo graph setting menu/Mode selection: Echo/SN
Signal
Level
Color
Level
-130 dB≧ 0
-122 below
1
-114 below 2
-106 below 3
-98 below
4
-90 below
5
-82 below
6
-74 below
7
-66 below
8
-58 below
9
-50 below
10
-42 below
11
-34 below
12
-26 below
13
-18 below
14
-18 dB<
15
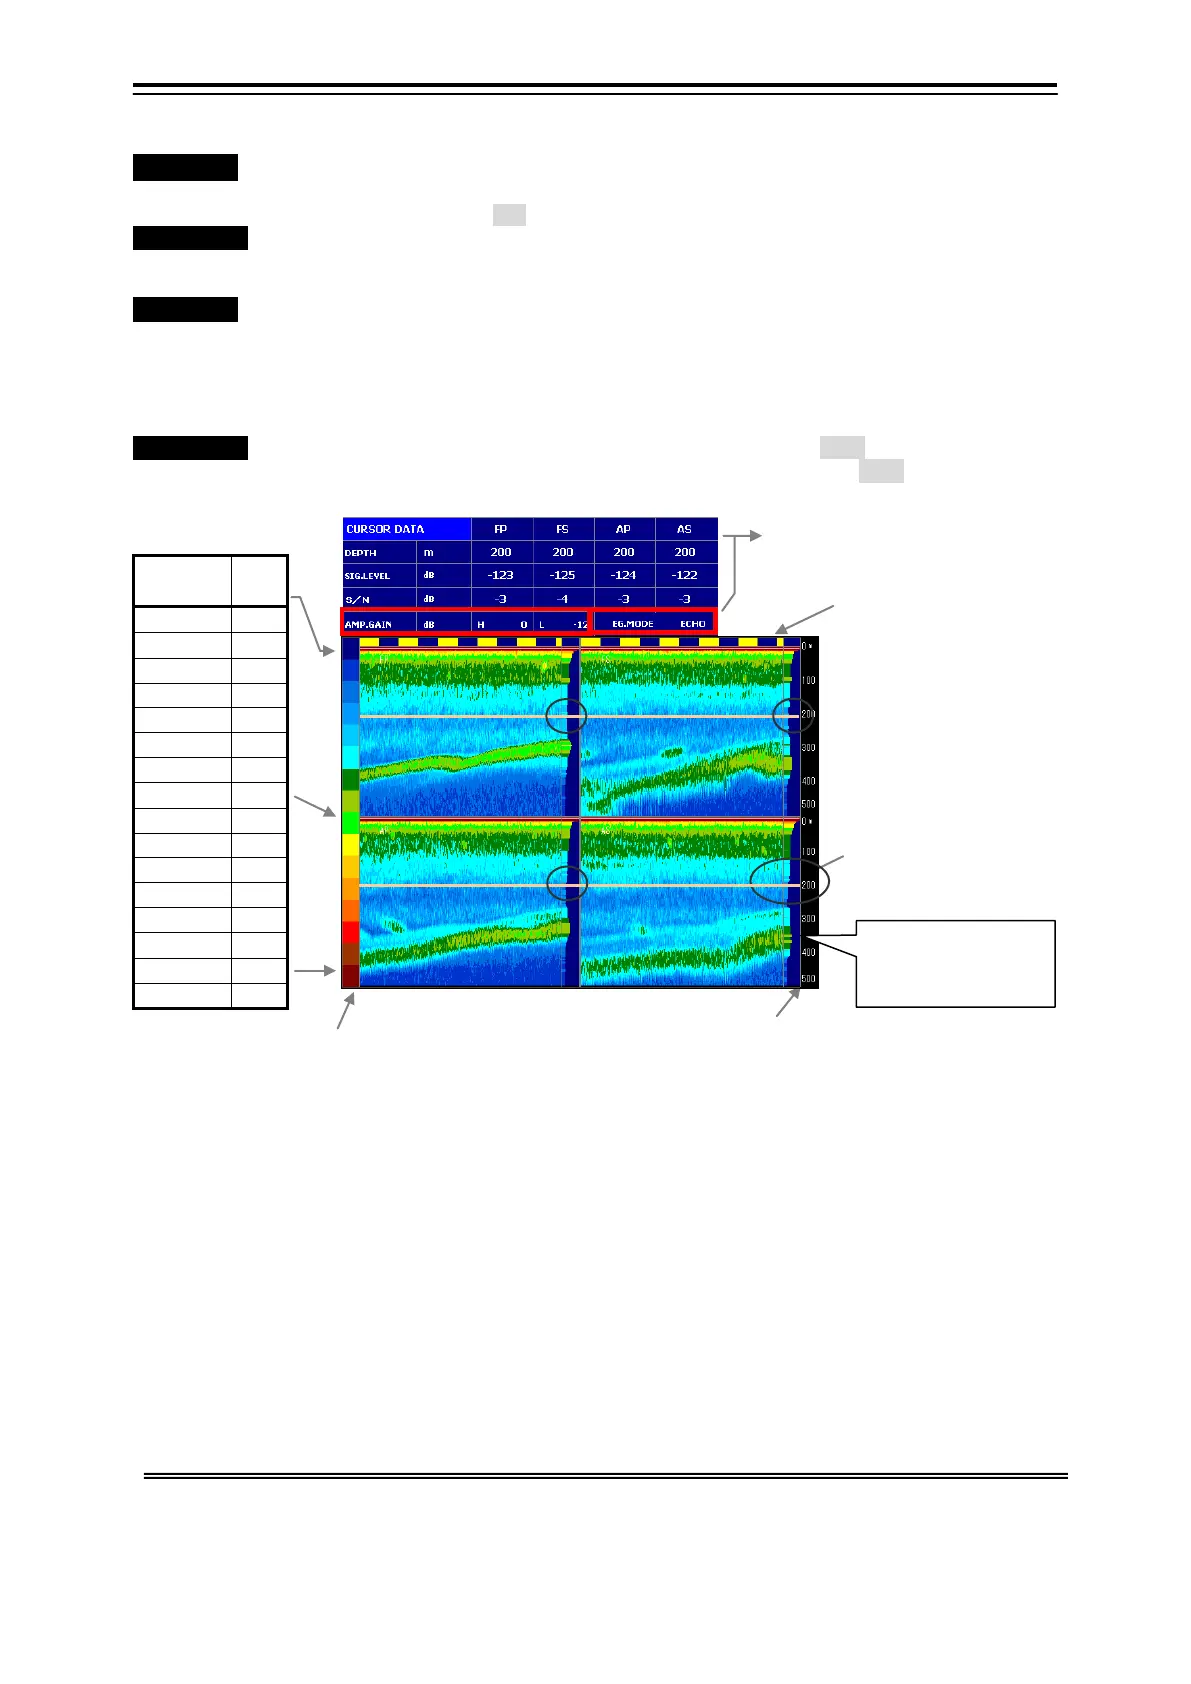
Fig. 4.2.2 Current 3 Screen Echo Graph
*1 Display mode: Refer to Fig. 4.2.2-⑮
*2 Color sample and signal level: Refer to Fig. 4.2.2 ③
*3 Cursor position echo table: Refer to Fig. 4.2.2 ⑪~⑭
*4 The input of depth of investigation in the sea bottom by the manual operation: Refer to 4.1.10 “Bottom Tracking Mode”.
③
Color Sample (Display color):
The displayed color arrangement of color is selected according to the
signal level of the echo. The display color can be selected from
A-D by the menu.
② Depth range of Echo Graph:
It sets within the range of 100-500m.
⑪
⑫
⑬
⑭
Time Mark:
It displays it at one minute
cycle.
The display color changes
every 30 seconds.
④The Data of Horizontal
Cursor Position Echo:
Refer to signal level ⑫.
①
The Data of Horizontal Cursor
Position Echo
of investigation in the
sea bottom by the
manual operation (*4)