1-18 Keysight B1505A User’s Guide, Edition 12
Getting Started
To Use Analysis Tools
To Use Analysis Tools
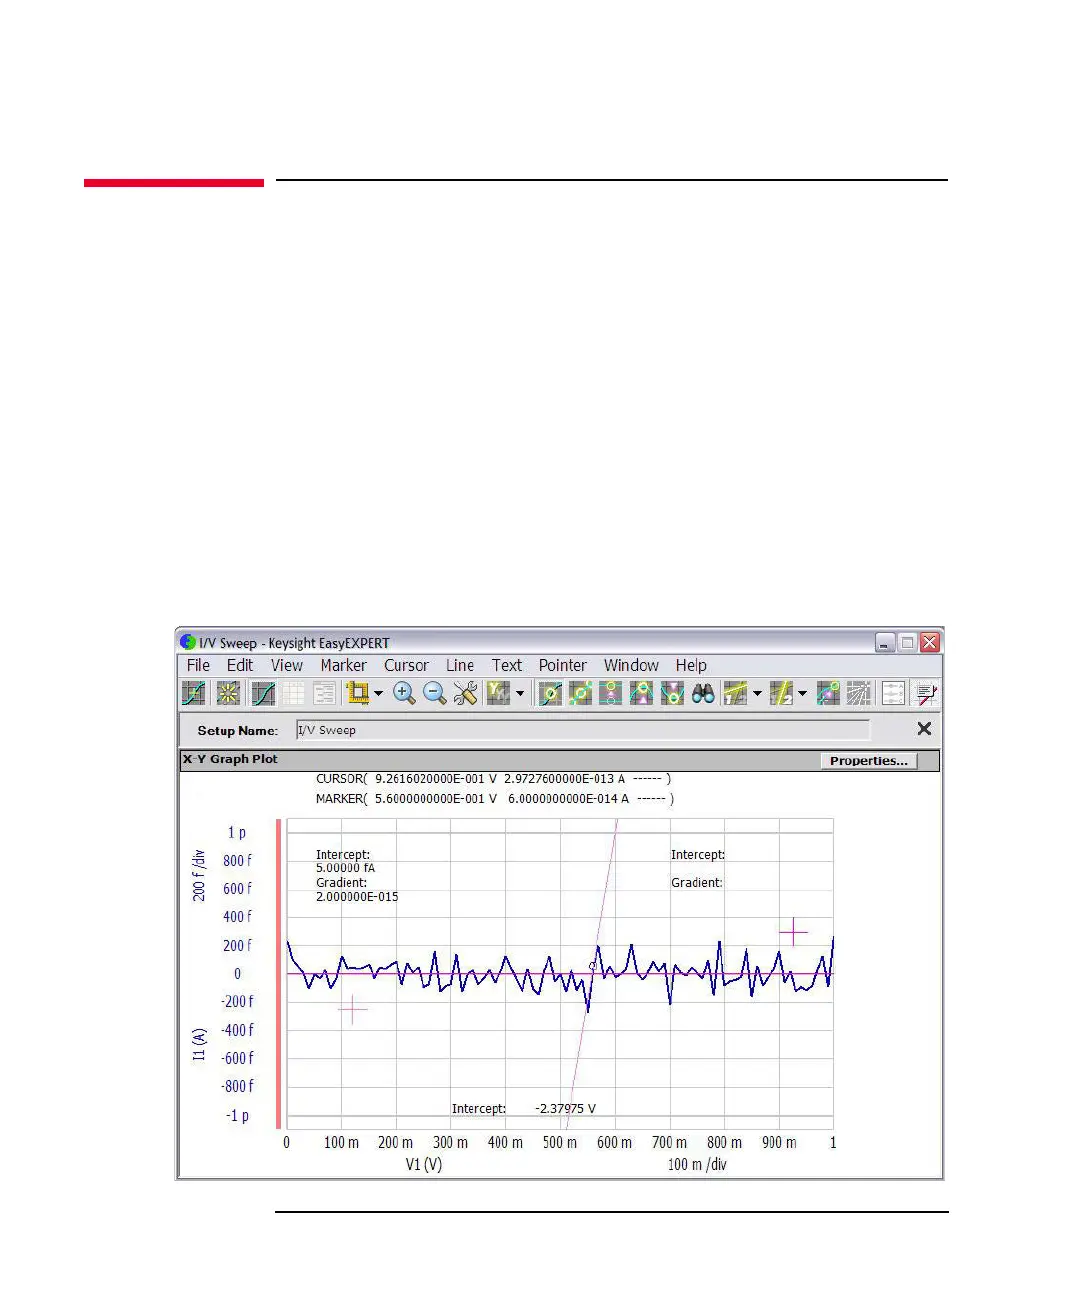
The Data Display window provides several analysis functions.
• View menu: used to adjust the graph scale.
• Marker menu: used to display and control the marker.
• Cursor menu: used to display and control the cursor.
• Line menu: used to display and control the lines.
When the marker, cursor, and lines are effective, their parameters are also displayed
on the X-Y Graph Plot area.
Figure 1-9 is an example displaying marker, tangent line, and regression line on the
test result graph shown in Figure 1-8. You can read position of the marker and the
active cursor, and interrupt and gradient of the active line.
Figure 1-9 Display Example of Analysis Tools