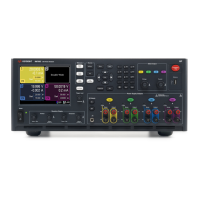
Standard View
Symbol/Field Description
1 TraceControls Identifies the volt/div. or curr/div. setting. √ indicates the traceis on.
Dashes (----) indicate the traceis off.
Select the traceand press Enter to turn iton or off.
2 Data Bar
Time Elapsed
The data bar represents all of the logged data. Theyellow partindicates the portion of the data that
is visibleon the display. Theblack part represents the data that is notvisible.
Indicates the time elapsed during the data log and the total duration. The values match when data
logging finishes.
3 Data Traces Voltagetracelabels appear on the left side of the grid (V1 V2, V3, V4).
Current trace labels appear on the right side of the grid (I1, I2, I3, I4).
Power tracelabels appear on the center of the grid (P1, P2, P3, P4).
If a portion of a traceis red, it means that portion of the traceis outof range.
Push the Trigger Level knob to auto-scale the data traces.
4 OutputPop-ups Turning the voltage and current knobs displays a pop-up dialog showing the present output
settings.
Pushing the voltage and currentknobs displays a pop-up dialog allowing the following actions:
• Lock/Unlock the voltage or currentknobs.
• On Models N678xA, select a limit parameter to control or select limit tracking.
5 Out of View Arrows Indicatethatthetrace, V4 in the figure, is outof view.
Use the Vertical Volt/Div knob or the Vertical Offset knob to bring the trace into view.
Push the Trigger Level knob to autoscale the data traces.
7 Trigger Level Shows the location of the voltageor current trigger level and output. In this example, the voltage
trigger level of output 1 is shown. The trigger source and amplitude are shown at the bottom right
of the display.
4 Using the Measurement Functions
148 Keysight N6705C Operating and Service Guide