EasyManua.ls Logo

Labconco Logic+ A2 - Page 82

Labconco Logic+ A2
201 pages
To Next Page IconTo Next Page
To Previous Page IconTo Previous Page
Loading...
82
15. Average all the readings. Apply the wind tunnel correction and local condition
corrections factors to the average velocity reading.
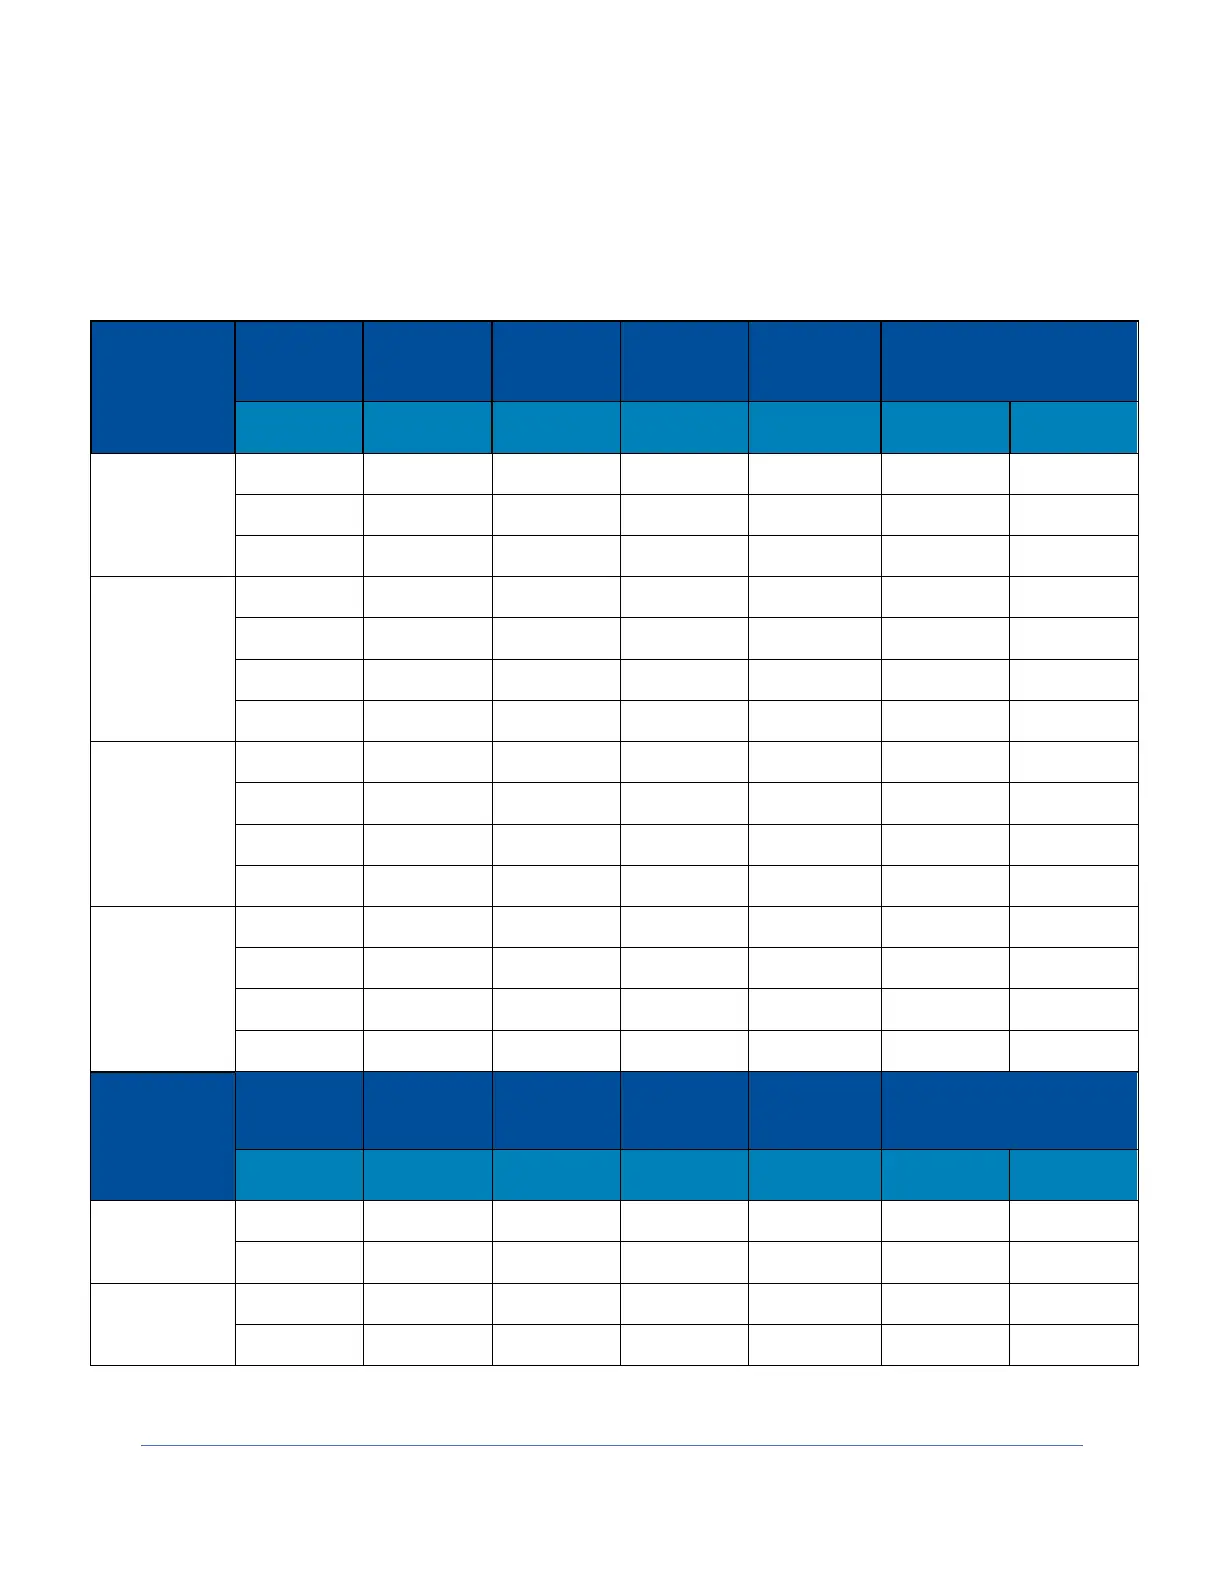
16. Multiply the average inflow velocity by the column Correction Factor” based on
Type and model in Table 10-8.
Type
A2 & B2
Cabinet
Width
Sash
Height
Sash
Stop
Template
Probe
Distance
# of Test
Points
Correction
Factor
Corrected Inflow
Volume Range
inches
inches
(mm)
CFM
m
3
/hr
3-foot
8
3+
4 (102)
6
0.95
203-223
345-379
9
3+
4 (102)
6
1
228-251
387-426
10
3+
4 (102)
6
0.95
253-278
430-472
4-foot
8
4+
3.25 (83)
8
1
269-296
457-503
9
4+
3.25 (83)
8
1
303-333
515-566
10
4+
3.25 (83)
8
1
337-371
573-630
12
4+
3.25 (83)
8
1.08
404-444
686-754
5-foot
8
5+
3.25 (83)
10
1
336-370
571-629
9
5+
3.25 (83)
10
1
378-416
642-707
10
5+
3.25 (83)
10
1
420-462
714-785
12
5+
3.25 (83)
10
1
505-555
858-943
6-foot
8
6+
4 (102)
12
1.83
403-443
685-753
9
6+
4 (102)
12
1.83
453-498
770-846
10
6+
4 (102)
12
1.83
503-553
855-940
12
6+
4 (102)
12
2.0
606-666
1030-1132
Type C1
Cabinet
Width
Sash
Height
Sash
Stop
Template
Probe
Distance
# of Test
Points
Correction
Factor
Corrected Inflow
Volume Range
inches
inches
(mm)
CFM
inches
4-foot
8
4+
3.25 (83)
8
1.08
269-296
457-503
10
4+
3.25 (83)
8
1.08
337-371
573-630
6-foot
8
6+
4 (102)
12
2
403-443
685-753
10
6+
4 (102)
12
2
503-553
855-940
Table 10-8

Table of Contents

Related product manuals