8-22
Windows Software Reference (Single Chamber Mode)
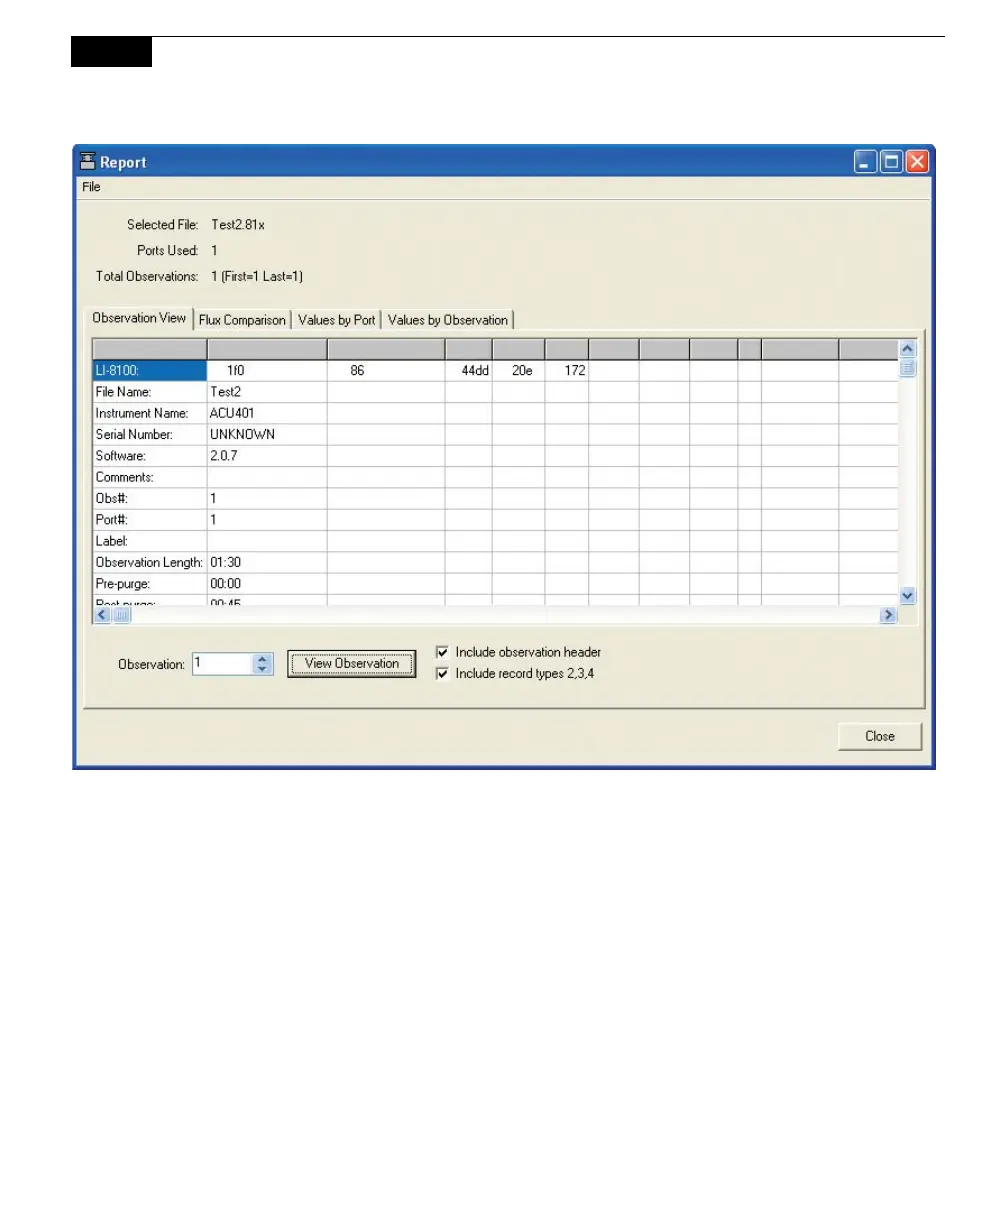
The Flux Comparison tab allows you to plot flux values on a chart. Choose the
number of flux data points to be plotted, and click Plot Fluxes. The Max Items
denotes the number of points to plot. The data plotted on the graph are always the
most recent in the file. Click Clear Chart to remove all plots from the chart.
 Loading...