Windows Software Reference (Single Chamber Mode)
8-23
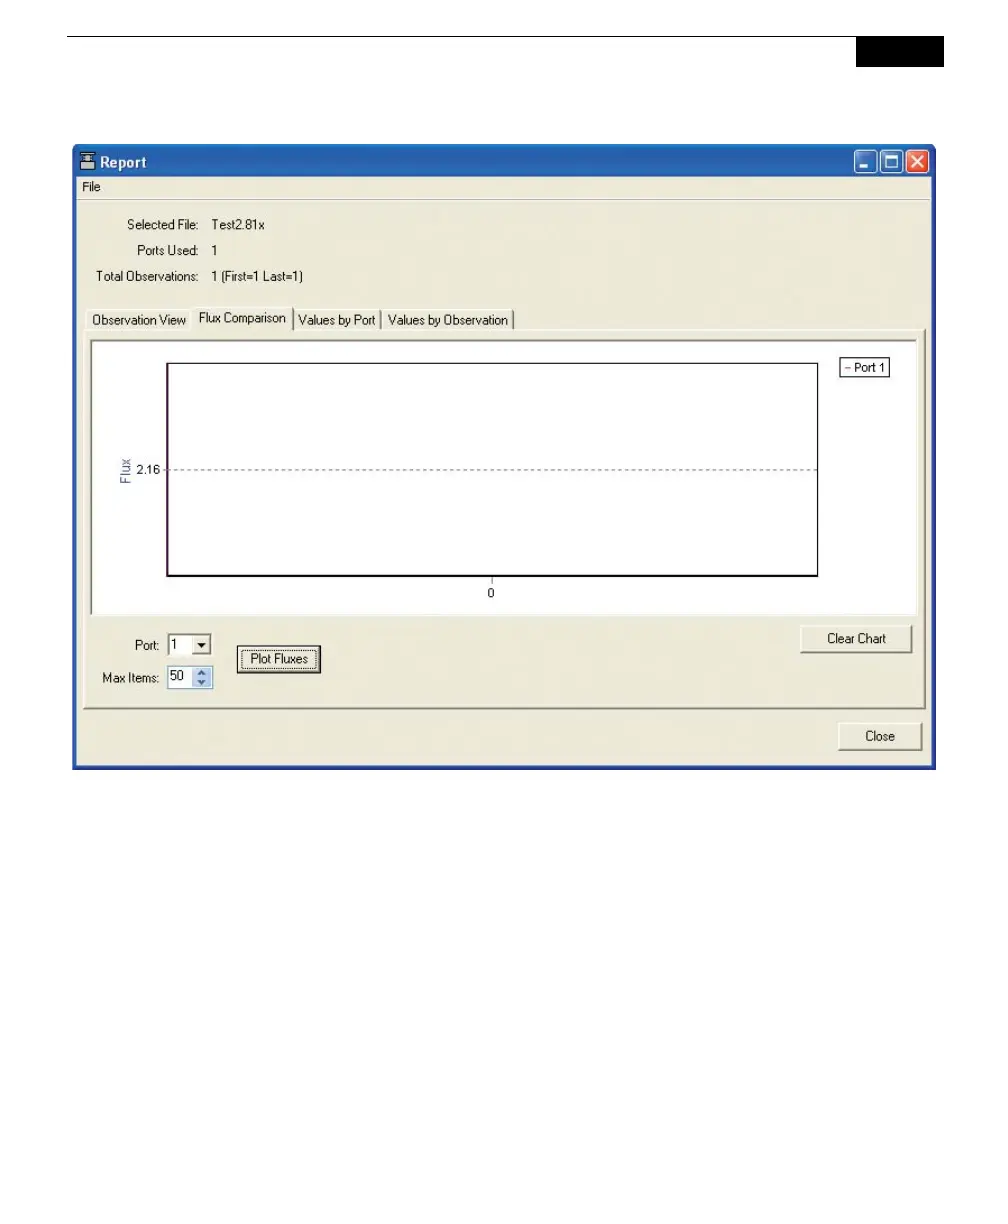
Click on Values by Port to graph two specific data items for a given port. The
points are data from the last (Max Items) observations. Select the variable to plot
on each axis. Click Plot. To automatically scale the left and/or right axes, click on
Chart Options. Enable automatic scaling, and set the maximum and minimum
values for the axes, if desired. To view the selected Observations in tabular format,
click on View Table. Click Clear Chart to remove all data from the chart.
 Loading...