8-24
Windows Software Reference (Single Chamber Mode)
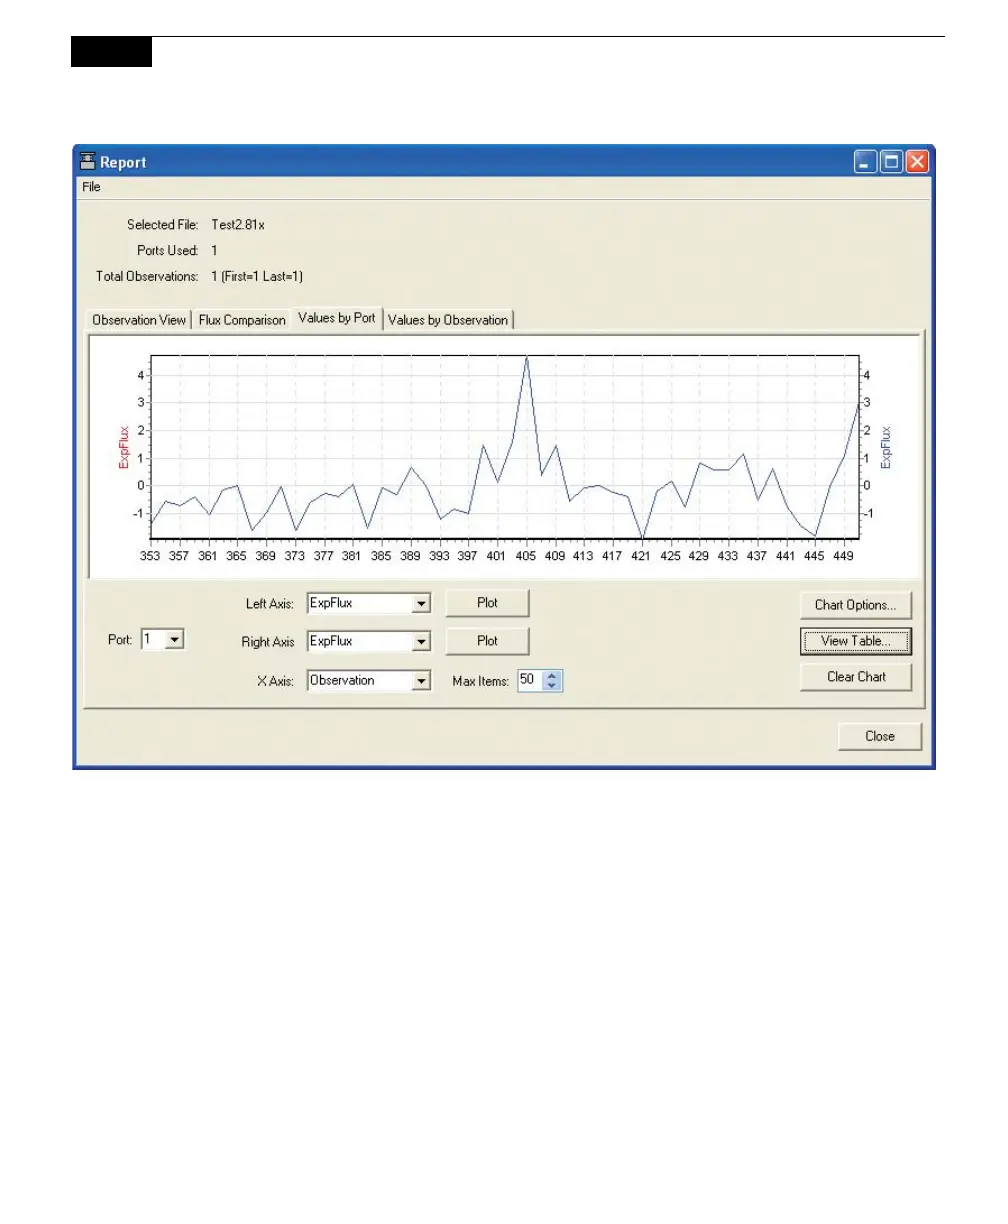
Click on Values by Observation to plot records by observation, on left and right
axes, against elapsed time (ETime). Values by Observation displays all of the raw
data values for a particular observation; this is used to view a single observation in
detail. Choose the Observation whose records you want to plot, and then select
the variable to plot on each axis. Click Plot.
 Loading...