Using the LI-8150 Multiplexer
10-55
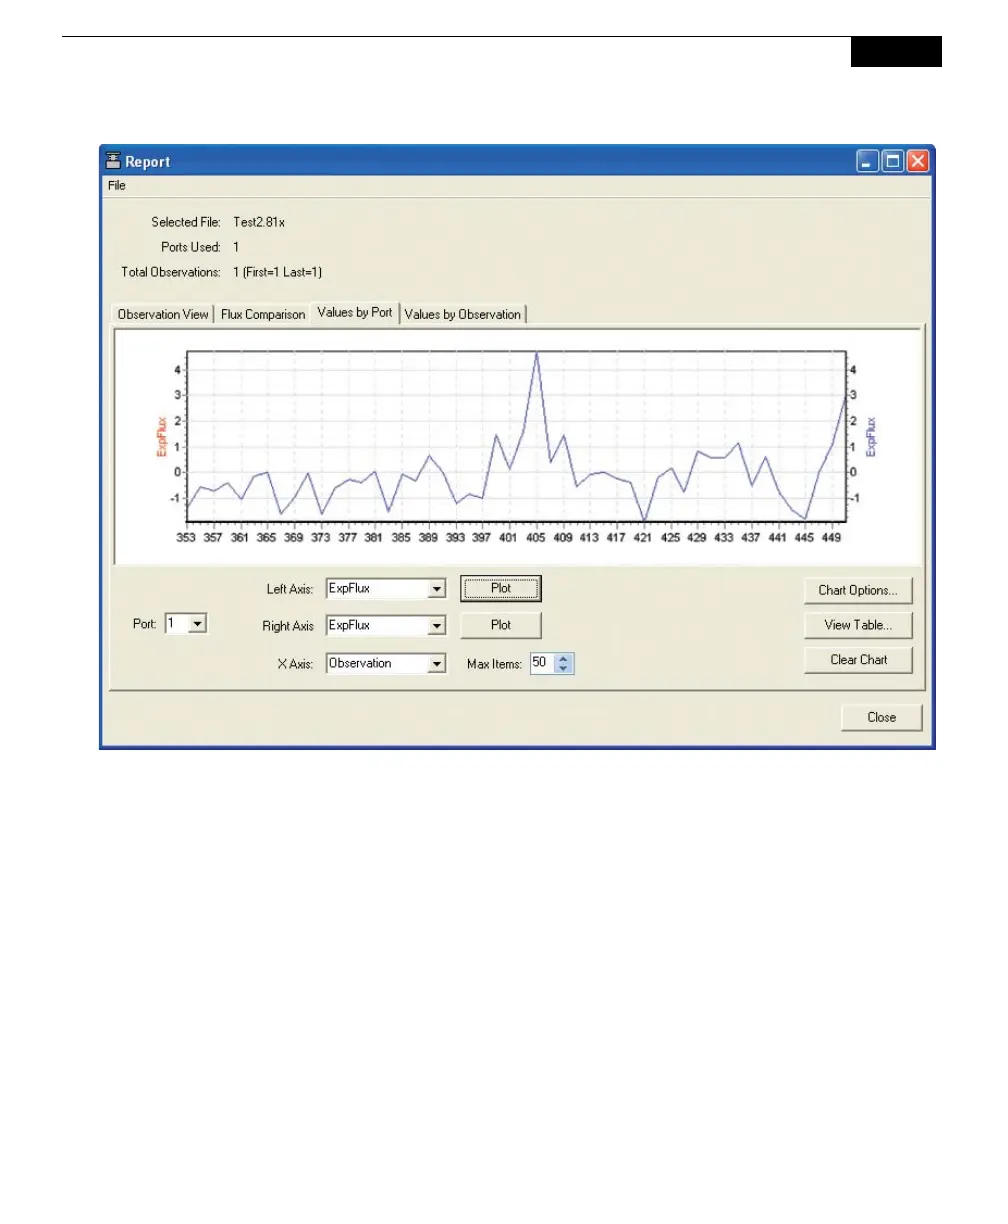
Click on Values by Observation to plot records by observation, on left and right
axes, against elapsed time (ETime). Choose the Observation whose records you
want to plot, and then select the variable to plot on each axis. Click Plot. To
automatically scale the left and/or right axes, click on Chart Options. Enable
automatic scaling, or set the maximum and minimum values for the axes, if
desired. To view the selected Observations in tabular format, click on View Table.
Click Clear Chart to remove all data from the chart.