6. Software Control – Lightware Device Controller Software MX-FR Series Modular Matrix Frames – User's Manual 79
Log
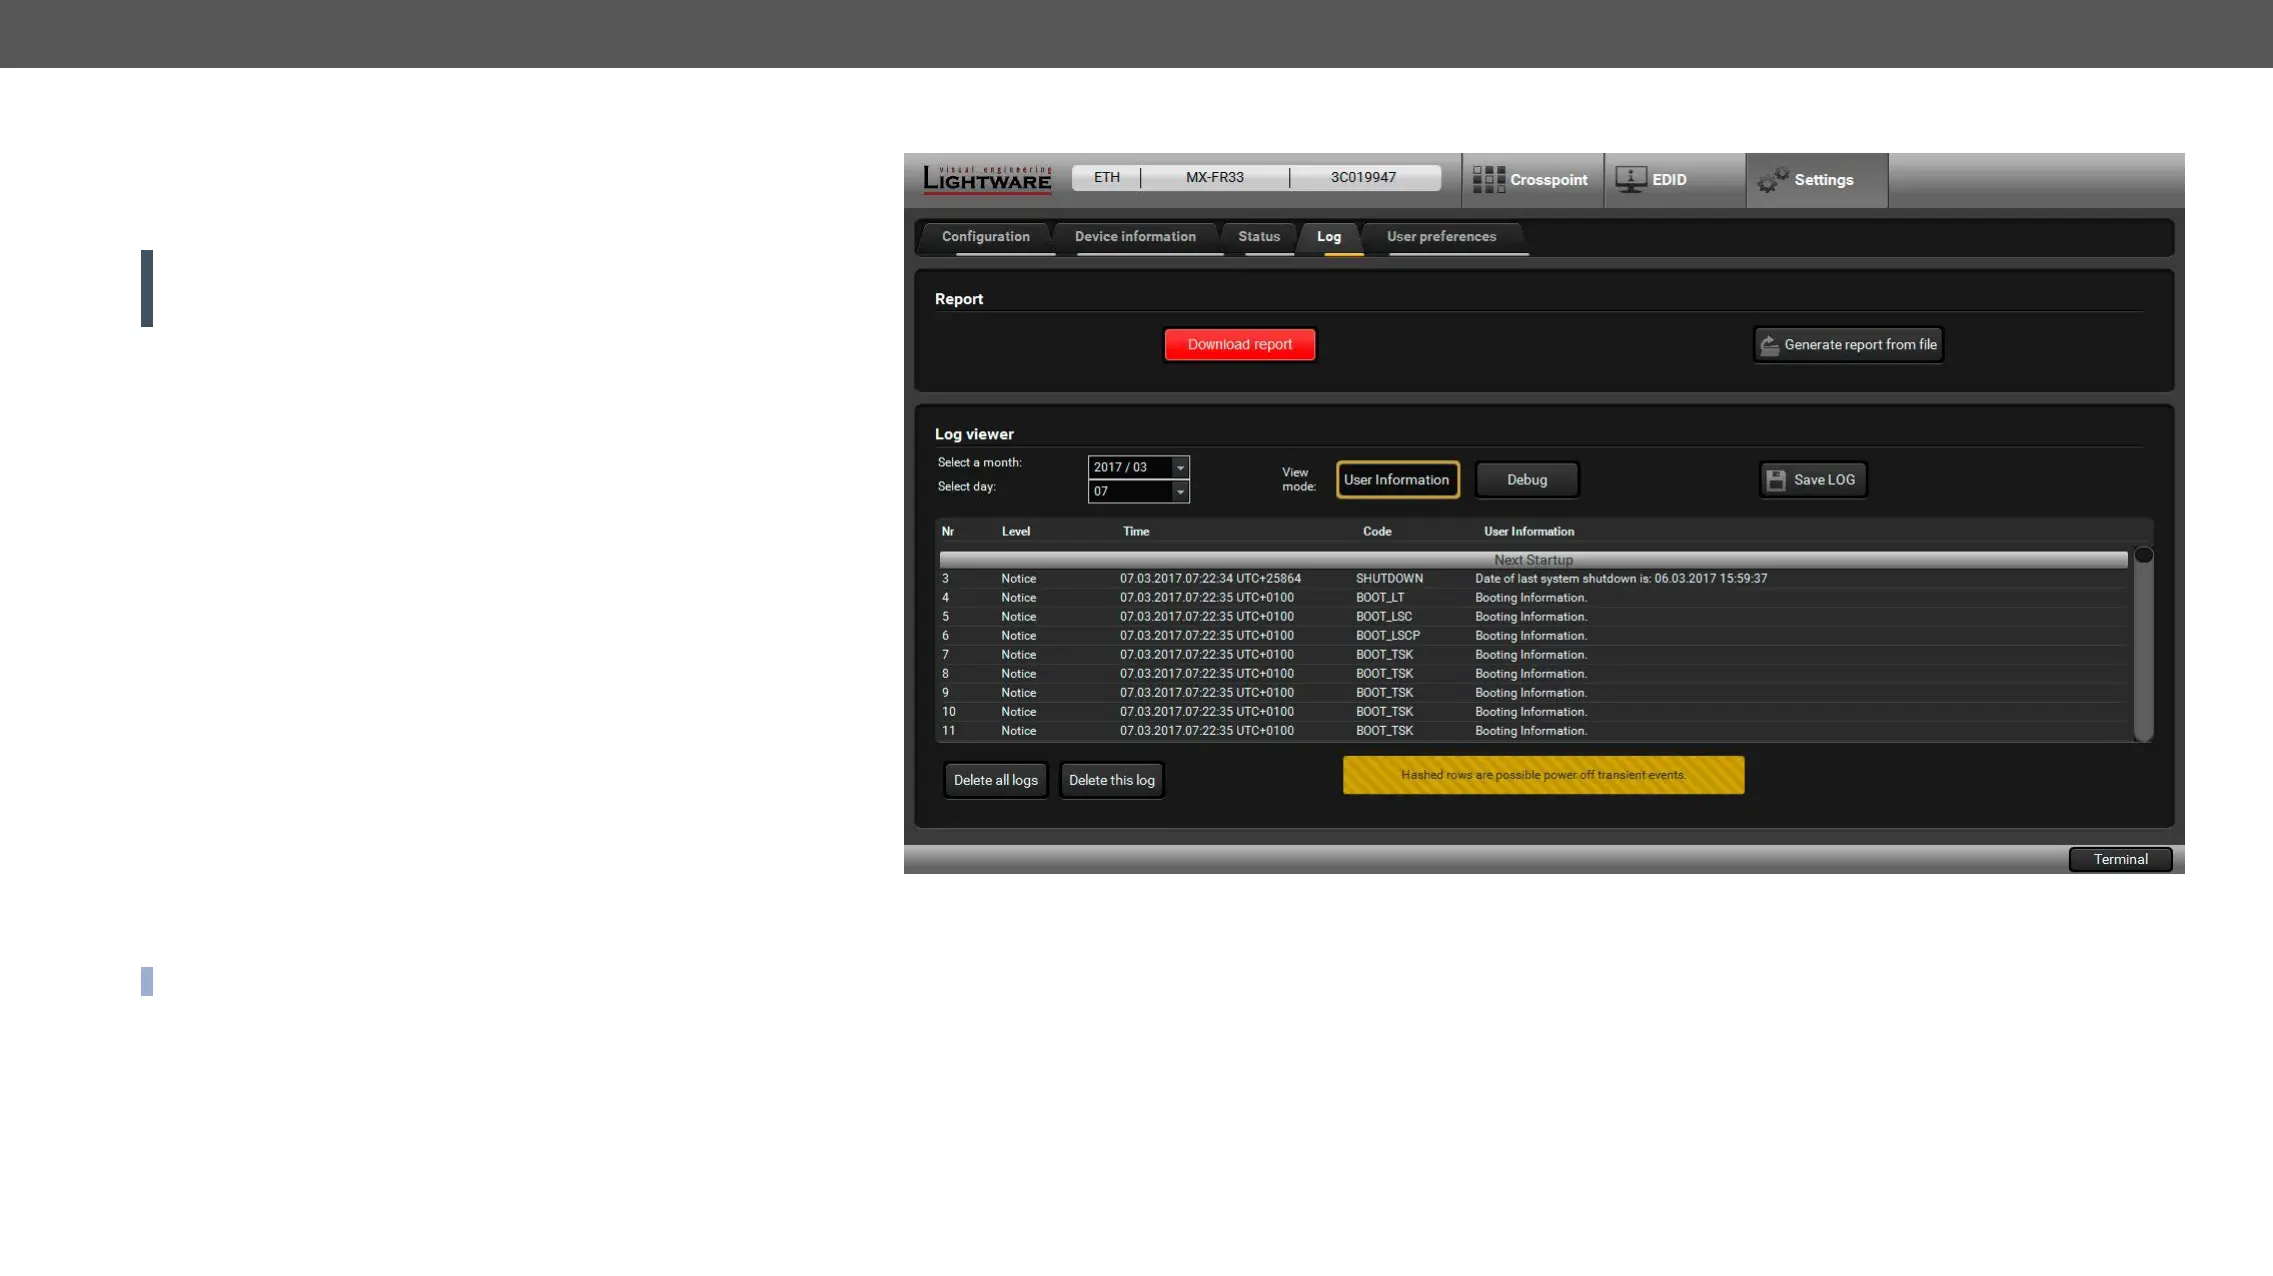
Events logged by the device and report generators can be found on
Log tab. There are two sections: Report and Log viewer.
Report Section
ATTENTION!
operating systems and under Firefox or Chrome web browsers only.
Apple Safari is not supported.
LDC is able to collect information from the device and save it to a
team when a problem may arise with the device:
Step 1. Press the red button: Generate report le.
Step 2. LDC collects the information; this may take up to 5 minutes.
Step 3. After generating the report, a Save as dialog box appears.
The report contains the following device-dependent information:
▪ Current command protocol,
▪ Device type and serial number,
▪ Current crosspoint state,
▪ Firmware versions of all the internal controllers,
▪
▪ Hardware health status,
▪ All EDID headers and status (emulated, dynamic, factory, user),
▪
Generate Report From File
device or troubleshooting.
INFO: This function is only for special troubleshooting cases.
Error Log Viewer
function. The columns in the list are the followings: error level, time,
extra information.
Status Tab
months and days, which have a log.
Step 1. Select the month of the error log.
Step 2. Select the day.
Step 3. The error log is downloaded and shown as a table.
Step 4.
There are two viewing modes are available:
▪ User information: the data is displayed in a structured, user-
friendly way; this is the recommended mode.
▪ Debug: Raw data display for special troubleshooting cases.
Logs can be deleted one-by-one or all the logs at the same time with
the Delete all logs and Delete this log buttons.