Scala | V7 | Servicing and Maintenance
8 Log to file: Export incoming messages into a text file.
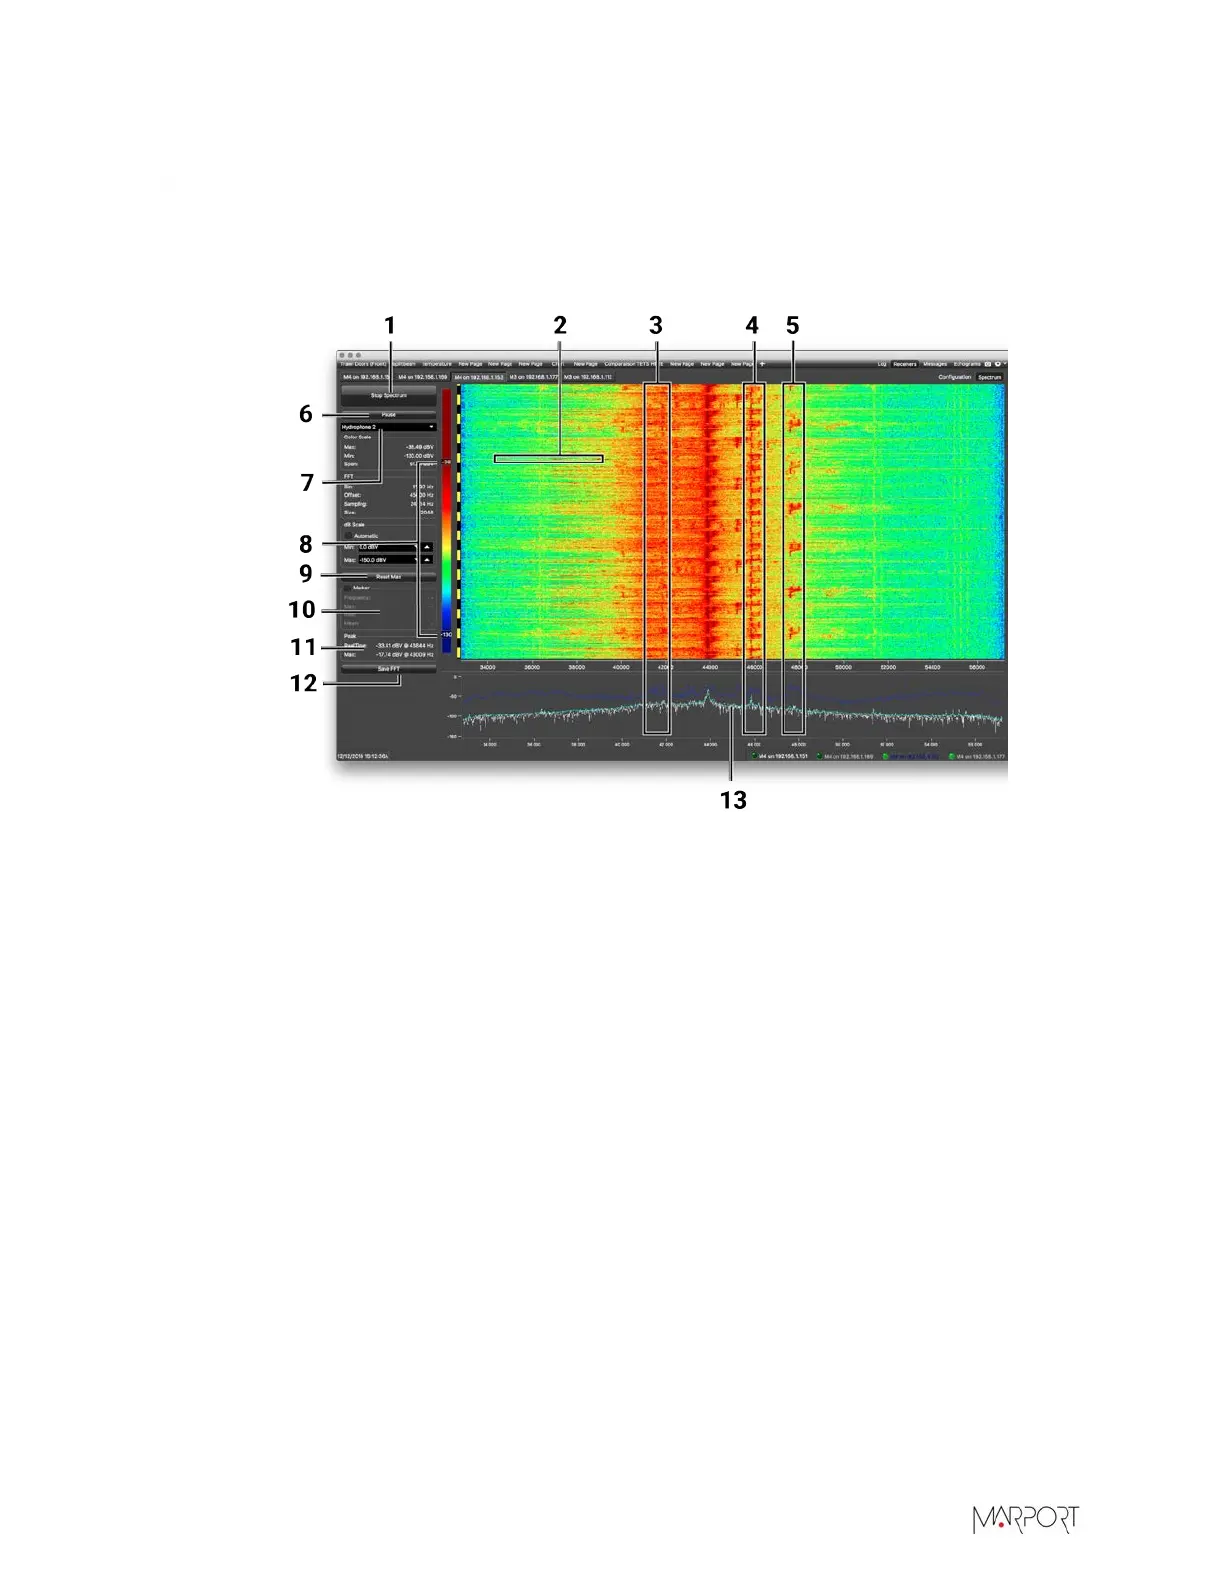
Spectrum Analyzer Display
The following picture explains the main parts of the spectrum analyzer page on Scala.
1
Start/Stop spectrum
analyzer
2
Noise interference
3
Pulses of the sensors (PRP)
4
Narrow band/HDTE signals
5
Door sounder signals
6
Pause spectrum analyzer
7
Select hydrophone
8
Drag to adjust color scale
9
Reset the Max line.
10 Marker: display frequency and levels of noise (dB)
at the mouse pointer location on the graph.
11 Peak:
•
RealTime: latest highest level of noise recorded.
•
Max: highest level of noise recorded since the
beginning of the spectrum.
12
Export recorded max, mean and real time noise
levels in a txt file.
13
• Dark blue line: maximum signal level
• Cyan line: average signal level
• White line: last received signal level
| 124
 Loading...