Scala | V7 | Display Configuration
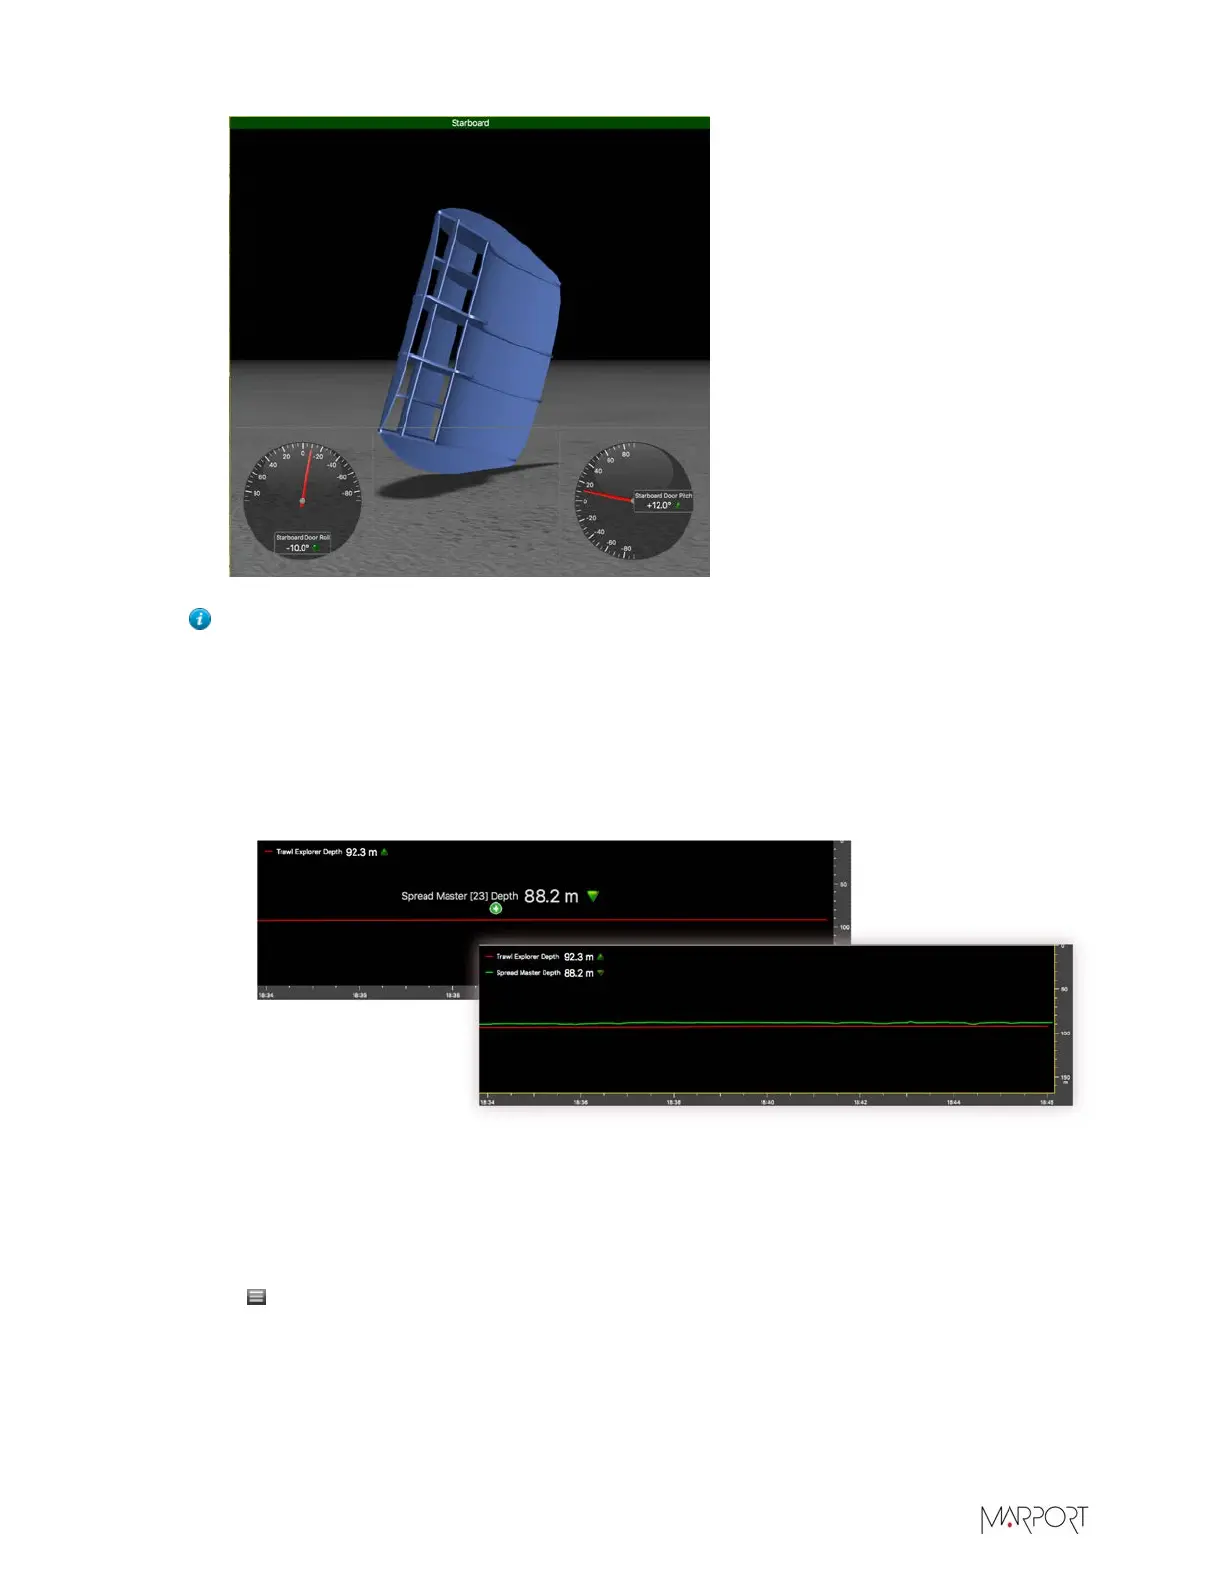
Tip: You can add multiple data in one history plot in order to easily compare different
data at the same time:
1.
Drag data, for example Depth from a Trawl Explorer, to a yellow area.
2.
In the Choose new Gauge Type dialog box, select History Plot.
3.
Drag other data, for example Depth from a Spread Master, to the first Depth history
plot.
4.
The second data appear in the history plot in another color.
What to do next
• To add other data, repeat the steps.
• When you have finished customizing pages, you need to deactivate the Customize mode: click
Menu > Customize again.
Removing Data from a Page
You can remove data such as a dial, an echogram, a plot, that is displayed on a page.
| 76
 Loading...