Scala | V7 | Display Configuration
Sensor Numerical Data
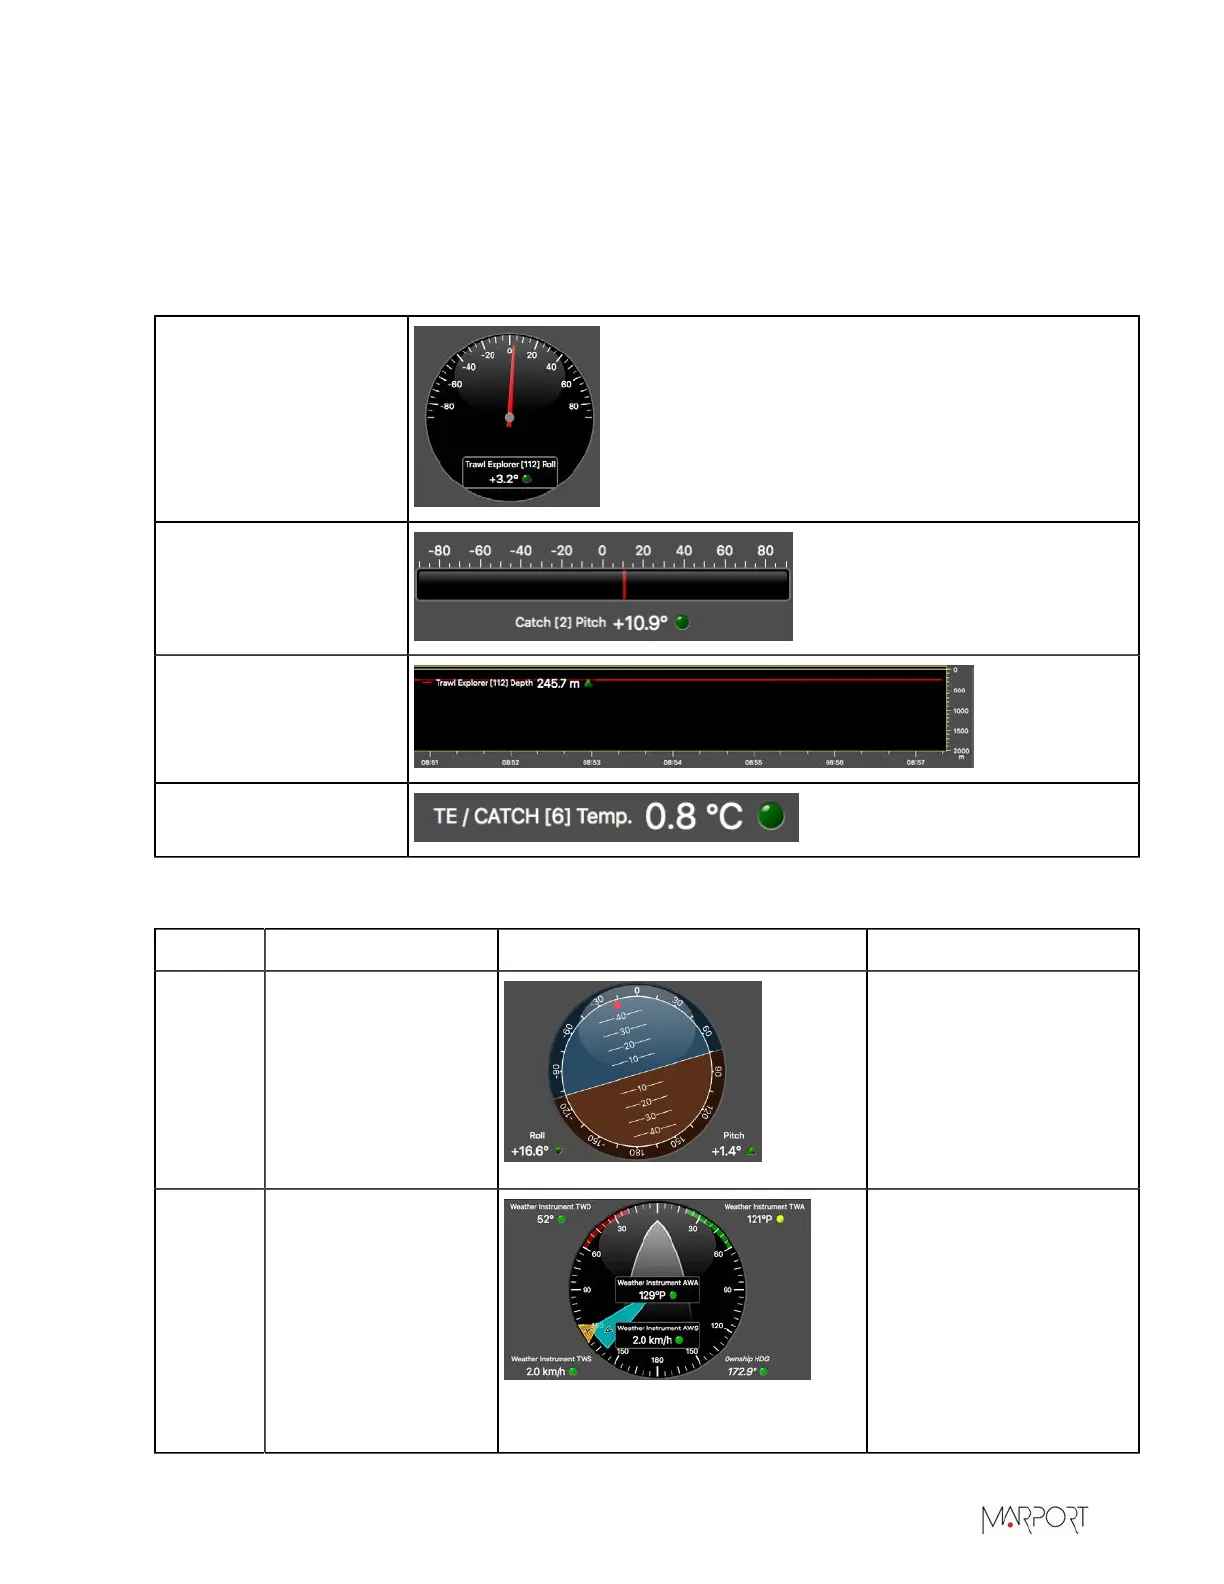
Data such pitch and roll, temperature, depth can be displayed in dials, gauges, history plots or text
format.
Display Types
You can choose between different types of display when you drag numerical data to a page.
Dial
Gauge
History Plot
Label
There are also dials specific to certain types of data:
Name Types of data Illustration Display details
Horizon
• Pitch
•Roll
Displays horizon line
according to pitch and
roll.
Red dot in the middle
indicates pitch angle
and red arrow on top
indicates roll angle.
Wind dial
• True wind speed
• True wind
direction
• True wind angle
• Apparent wind
angle
• Apparent wind
speed
Vessel is displayed in the
middle in grey.
Apparent wind angle is
displayed in blue and true
wind angle in orange.
| 93
 Loading...