Scala | V7 | System Configuration
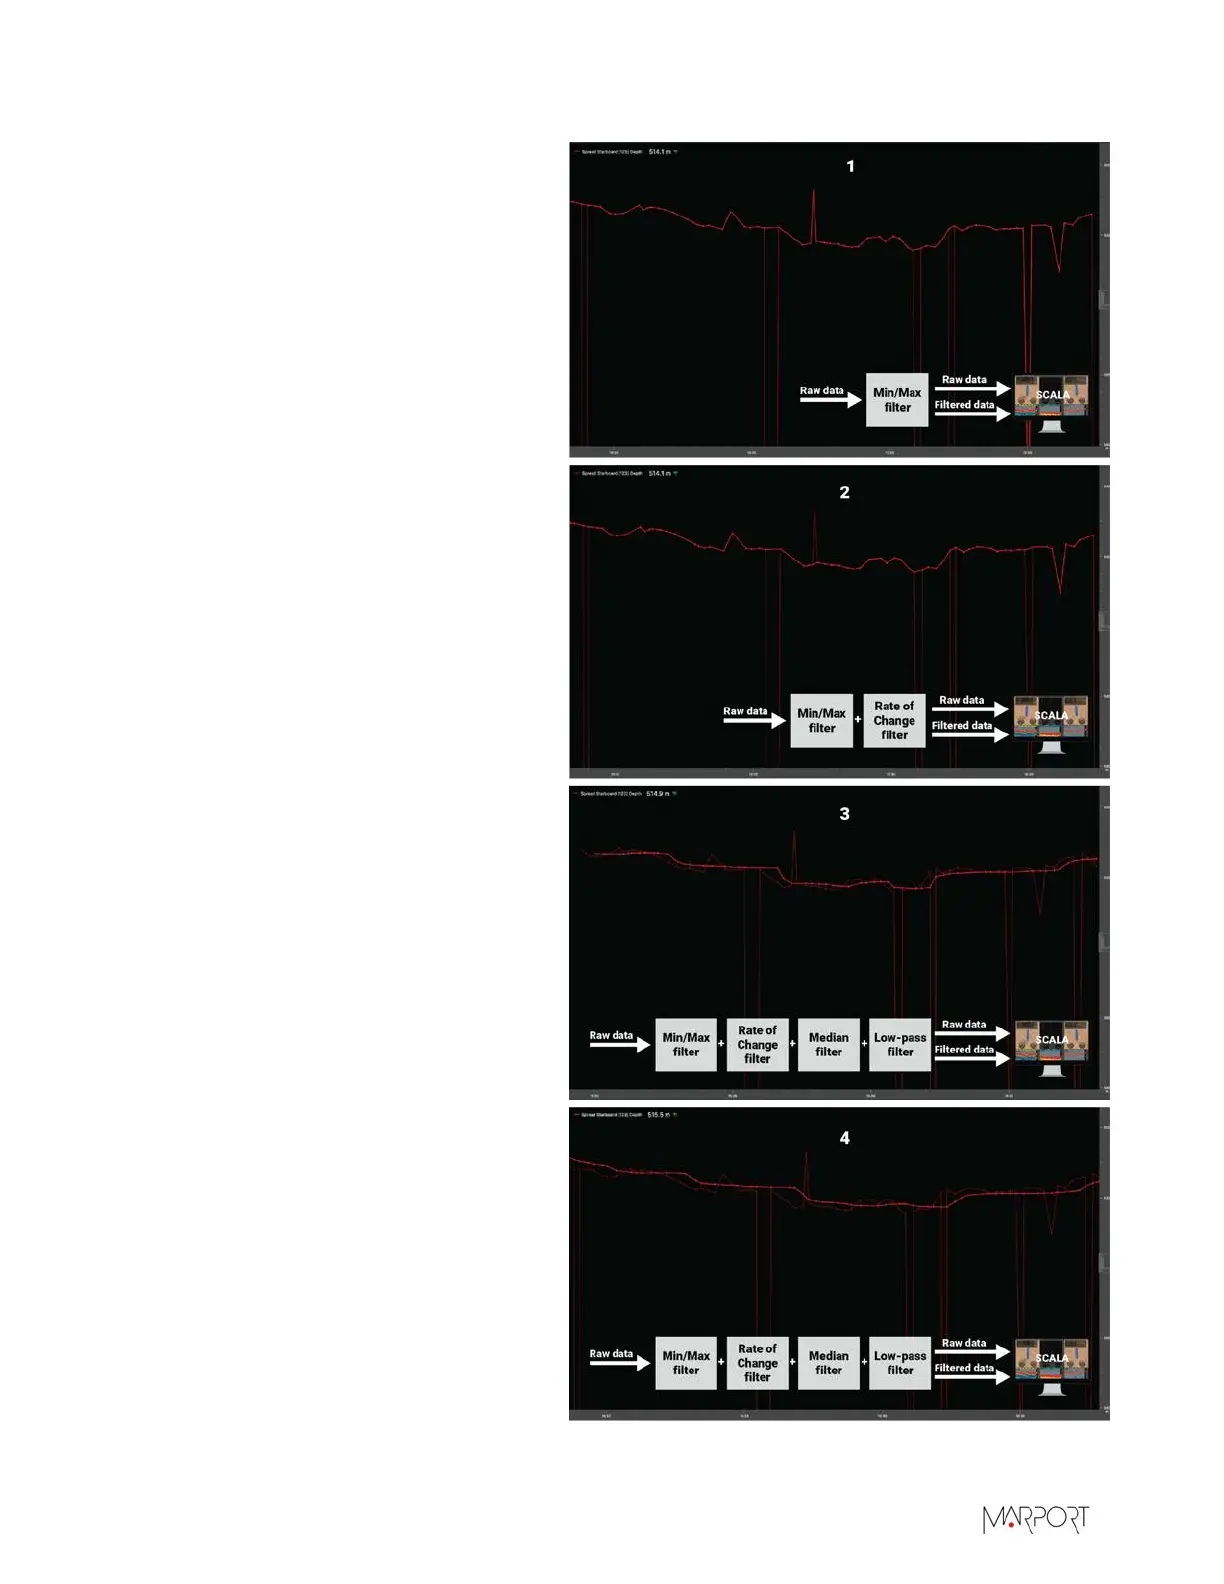
These pictures show the effects of the
filters on the incoming data. The filters
Min/Max (1), Rate of Change (2), Some
Smoothing (3) and More Smoothing
(4) have been applied one by one to the
data so that you can see the evolution.
The lighter line in the background is the
raw data.
| 35
 Loading...