Root NIBPT Chapter 3: Operation
www.masimo.com 43 Masimo
Using Trend View
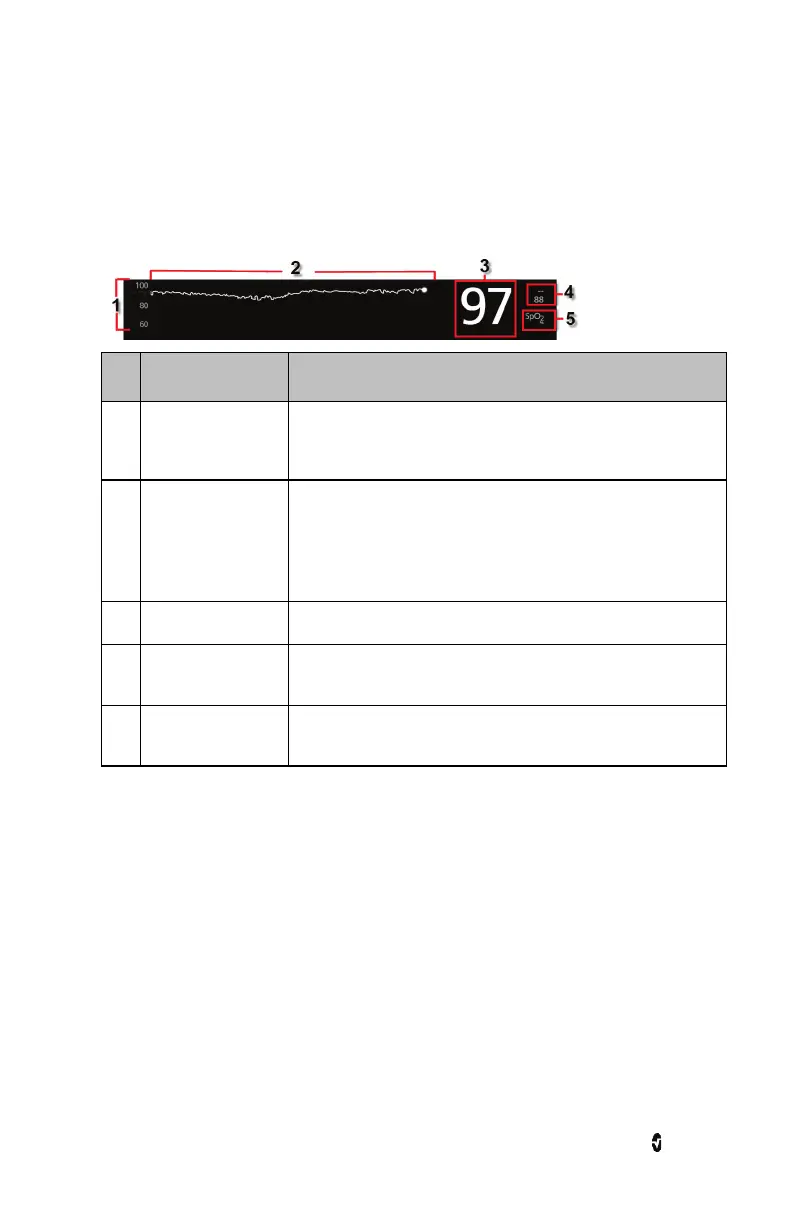
In Trend View, a parameter or measurement is displayed as a graph of its values over time.
The following diagram and table describe key features of a parameter's Trend Display in
Trend View.
Ref.
Feature Description
1 Value Range
Indicates current viewing of the parameter or measurement.
Press to access the Trend menu where the minimum and
maximum of the range can be modified.
2 Trend Graph
Displays parameter and measurement over a period of time.
Zoom in and out of a Trend Graph by pinching out and in.
3 Numeric Value Indicates current reading of the parameter or measurement.
4 Alarm Limits
Indicate high and low alarm limits for the parameter or
measurement, if supported.
5
Parameter or
Measurement Label
Indicates the name of the parameter or measurement.