Solver NEXT SPM. Instruction Manual
164
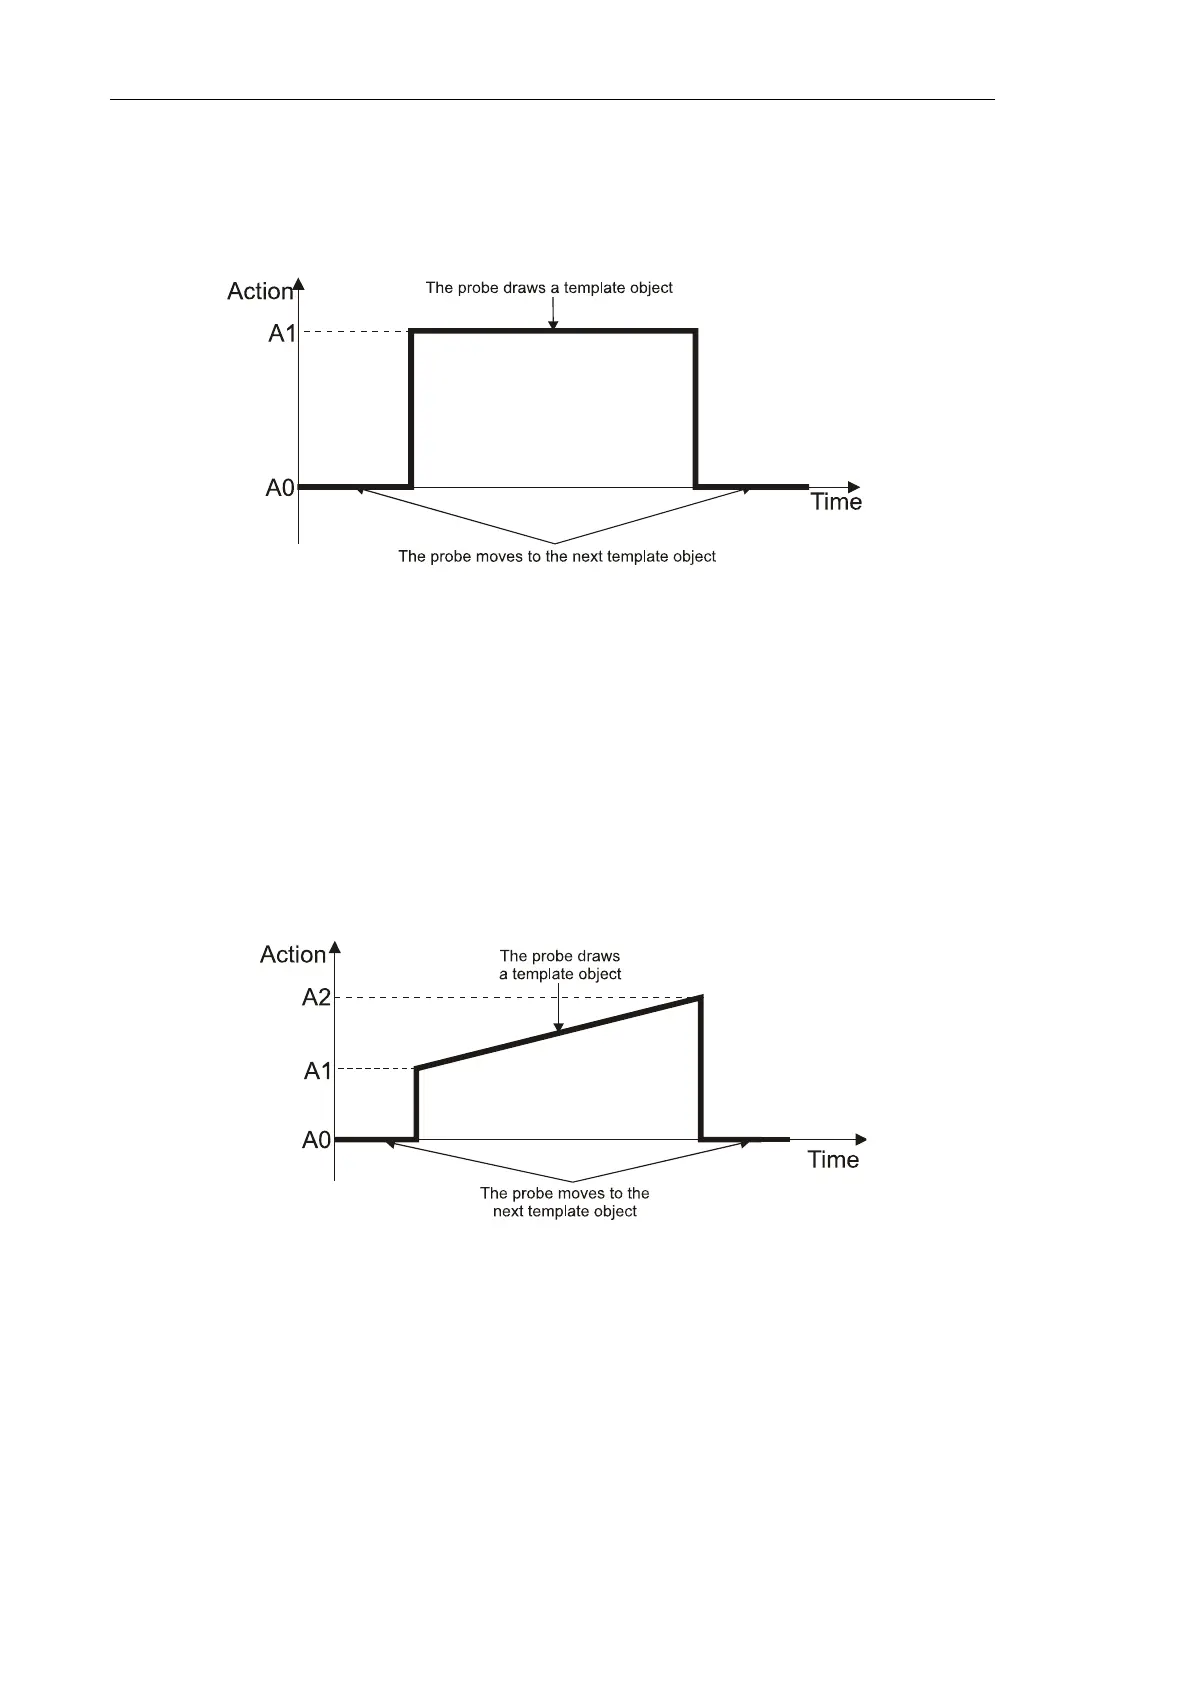
8.1.1.1. Simple vector lithography
The Figure below demonstrates a time diagram of the force applied to the sample in the
course of the Simple vector lithography (Fig. 8-1).
Fig. 8-1. Force applied to the sample in the course of the Simple vector lithography
When the probe draws an object of the lithography template, the sample is applied to the
constant force A1. Level of the A1 parameter is defined in the Action field of the Control
panel of the Litho window.
8.1.1.2. Gradient lithography
The Figure below demonstrates a time diagram of the force applied to the sample in the
course of the Gradient lithography (Fig. 8-2).
Fig. 8-2. Force applied to the sample in the course of the Gradient lithography
When the probe draws an object of the lithography template, the sample is applied to the
force is ramping linearly from the A1 level to the A2 level. The lowest (A1) and the highest
(A2) levels are defined in the fields Action 1 and Action 2 of the Control panel of the Litho
window, respectively.