Solver NEXT SPM. Instruction Manual
152
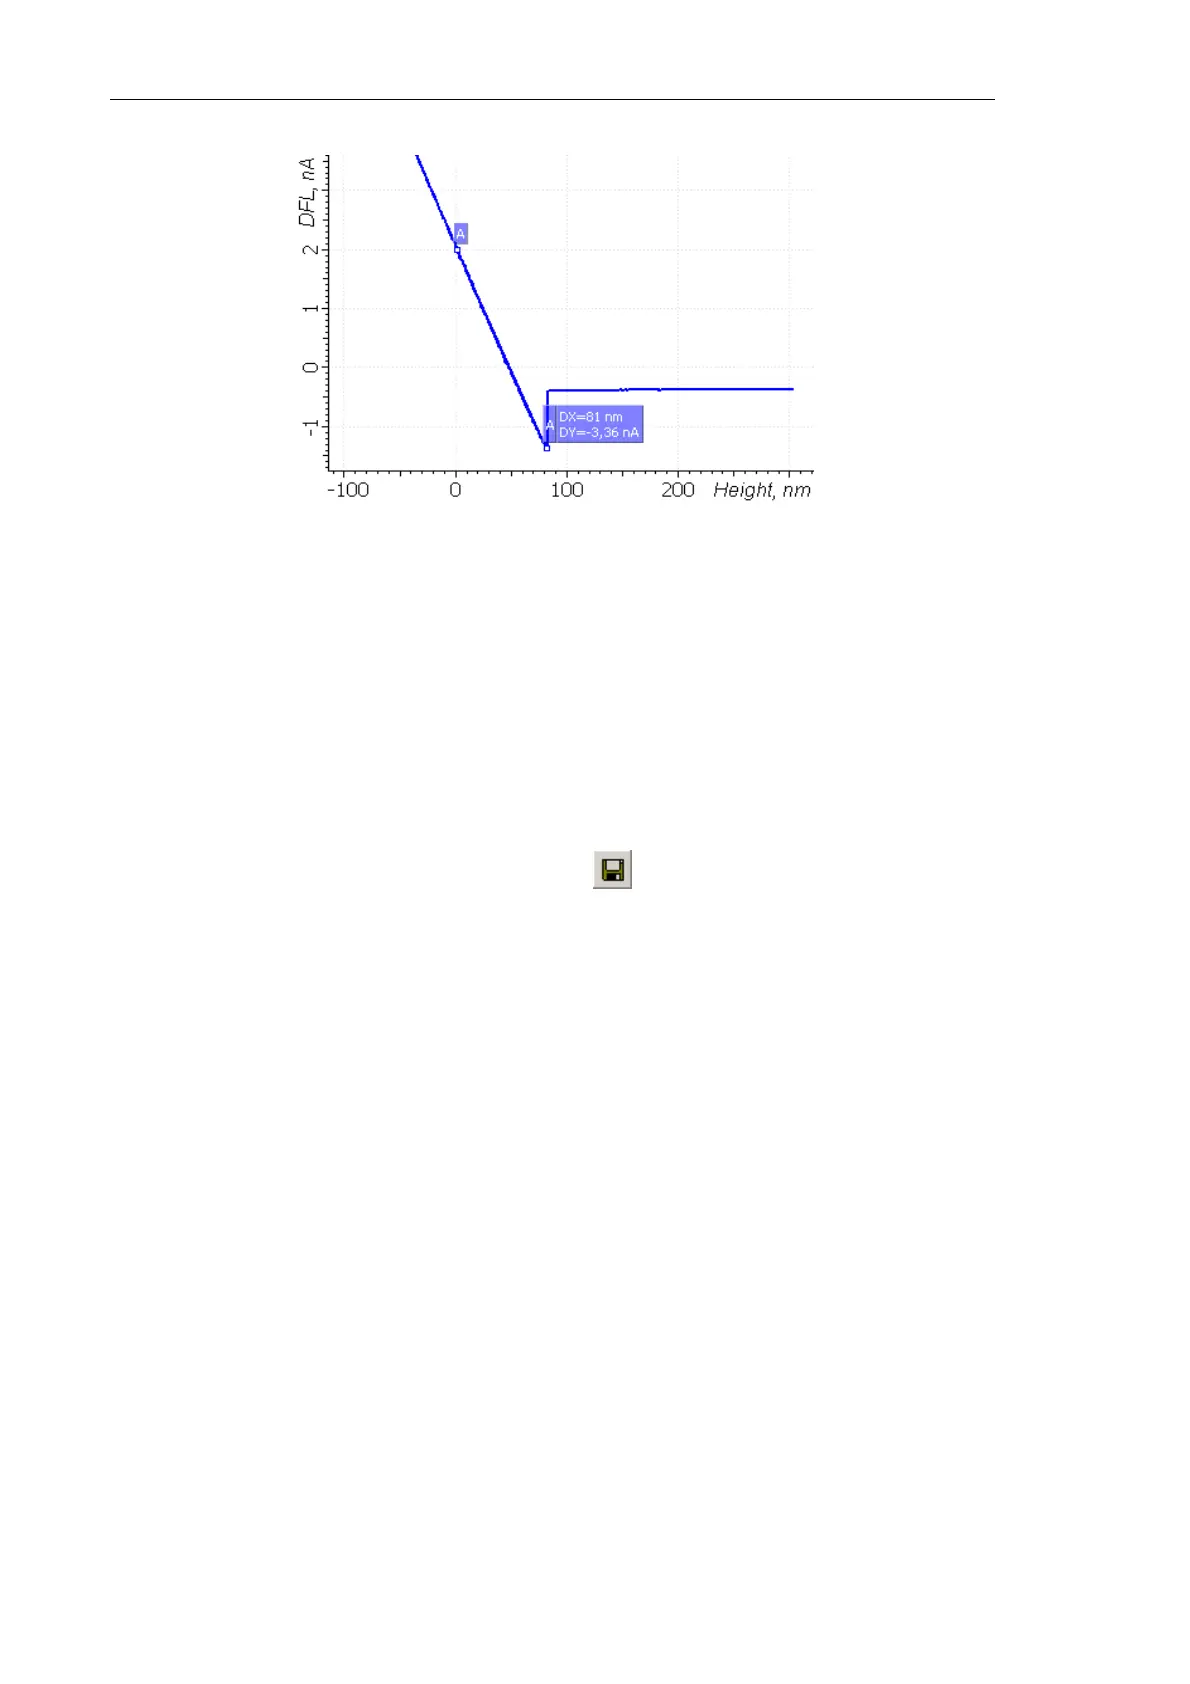
Fig. 7-140
In our example of measurements in the Constant Force mode with Set Point = 2 nA, the
pressing force is maintained equal to:
0.03 / 81 2.4
Nm nm nN=×≈
. (3)
7.5.1.6. Saving Measurement Data
The frame of spectroscopy data is automatically attached to the data file. To save the
spectroscopy data in a separate text file, click the button in the Toolbar of the Viewing
Area
7.5.2. Amplitude Spectroscopy Mag(Z)
In amplitude spectroscopy the amplitude of the cantilever oscillations is measured as a
function of the scanner z-tube extension, i.e. the
Mag(Z) curve is obtained, where Mag – is
the signal proportional to the cantilever oscillation amplitude and Z – is the parameter
describing the variation of the scanner z-tube length.
Using the dependence of the amplitude from the piezotube extension it is possible to
calibrate the amplitude of the cantilever oscillations.
Spectroscopy measurements could be started as soon as the probe has been approached to
the surface using the semicontact mode (see i. 7.2.1 “Semicontact Mode” on p. 84).
7.5.2.1. Configuring and Making Measurements
The preparatory and measurement procedures are similar to those discussed in
i. 7.5.1 ”Force-distance Spectroscopy” on p. 141. Hence, just a brief algorithm is given
below. Only the stages that differ from the standard procedure are considered in detail.