Solver NEXT SPM. Instruction Manual
82
7.1.5.4. Scanning
Click the button Run, which is on the control panel of the Scan tab, to trigger the process
of scanning.
The following actions take place:
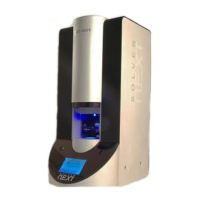
● Line-by-line scanning of the sample surface starts and three images appear in the field
of 2D visualization of the scanning data. One of them is an image of surface
topography (signal Height), the second image is the amplitude of normal oscillations
(signal Mag) and the third one is the distribution of normal phase (signal Phase)
(Fig. 7-39).
Fig. 7-39. Images of the surface under investigation
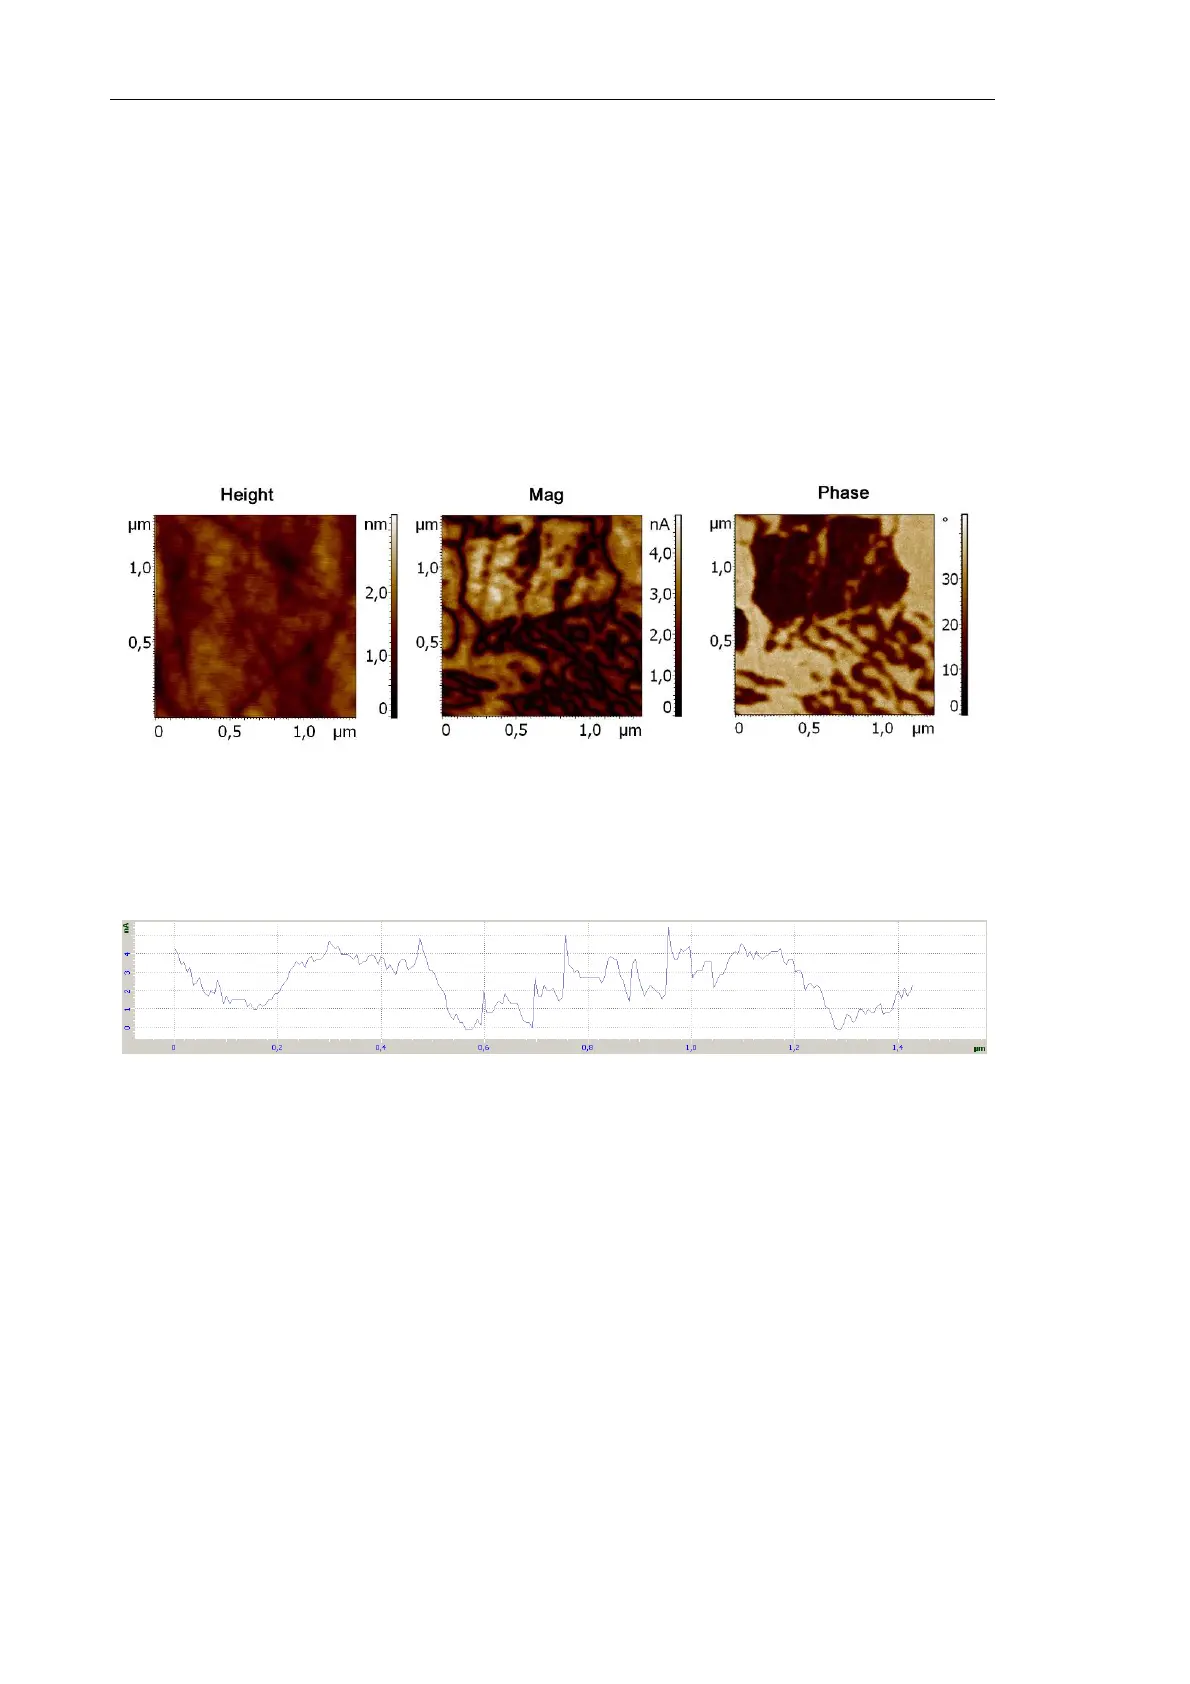
● The panel of 1D images visualizes the signal measured line-by-line (Fig. 7-40).
Fig. 7-40. Signal Mag
NOTE. Normal oscillations of the cantilever (signal
DFL
) are registered for the default
settings in the Piezoresponse Force Microscopy mode. For registration of lateral
oscillations, connect the input of the lock-in amplifier to the
LF
(
LF×10
) signal.