Chapter 7. Performing Measurements
83
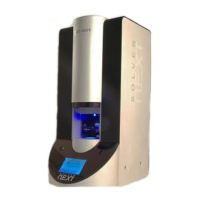
Fig. 7-41
After switching the inputs of the lock-in amplifier and the phase detector from DFL to LF,
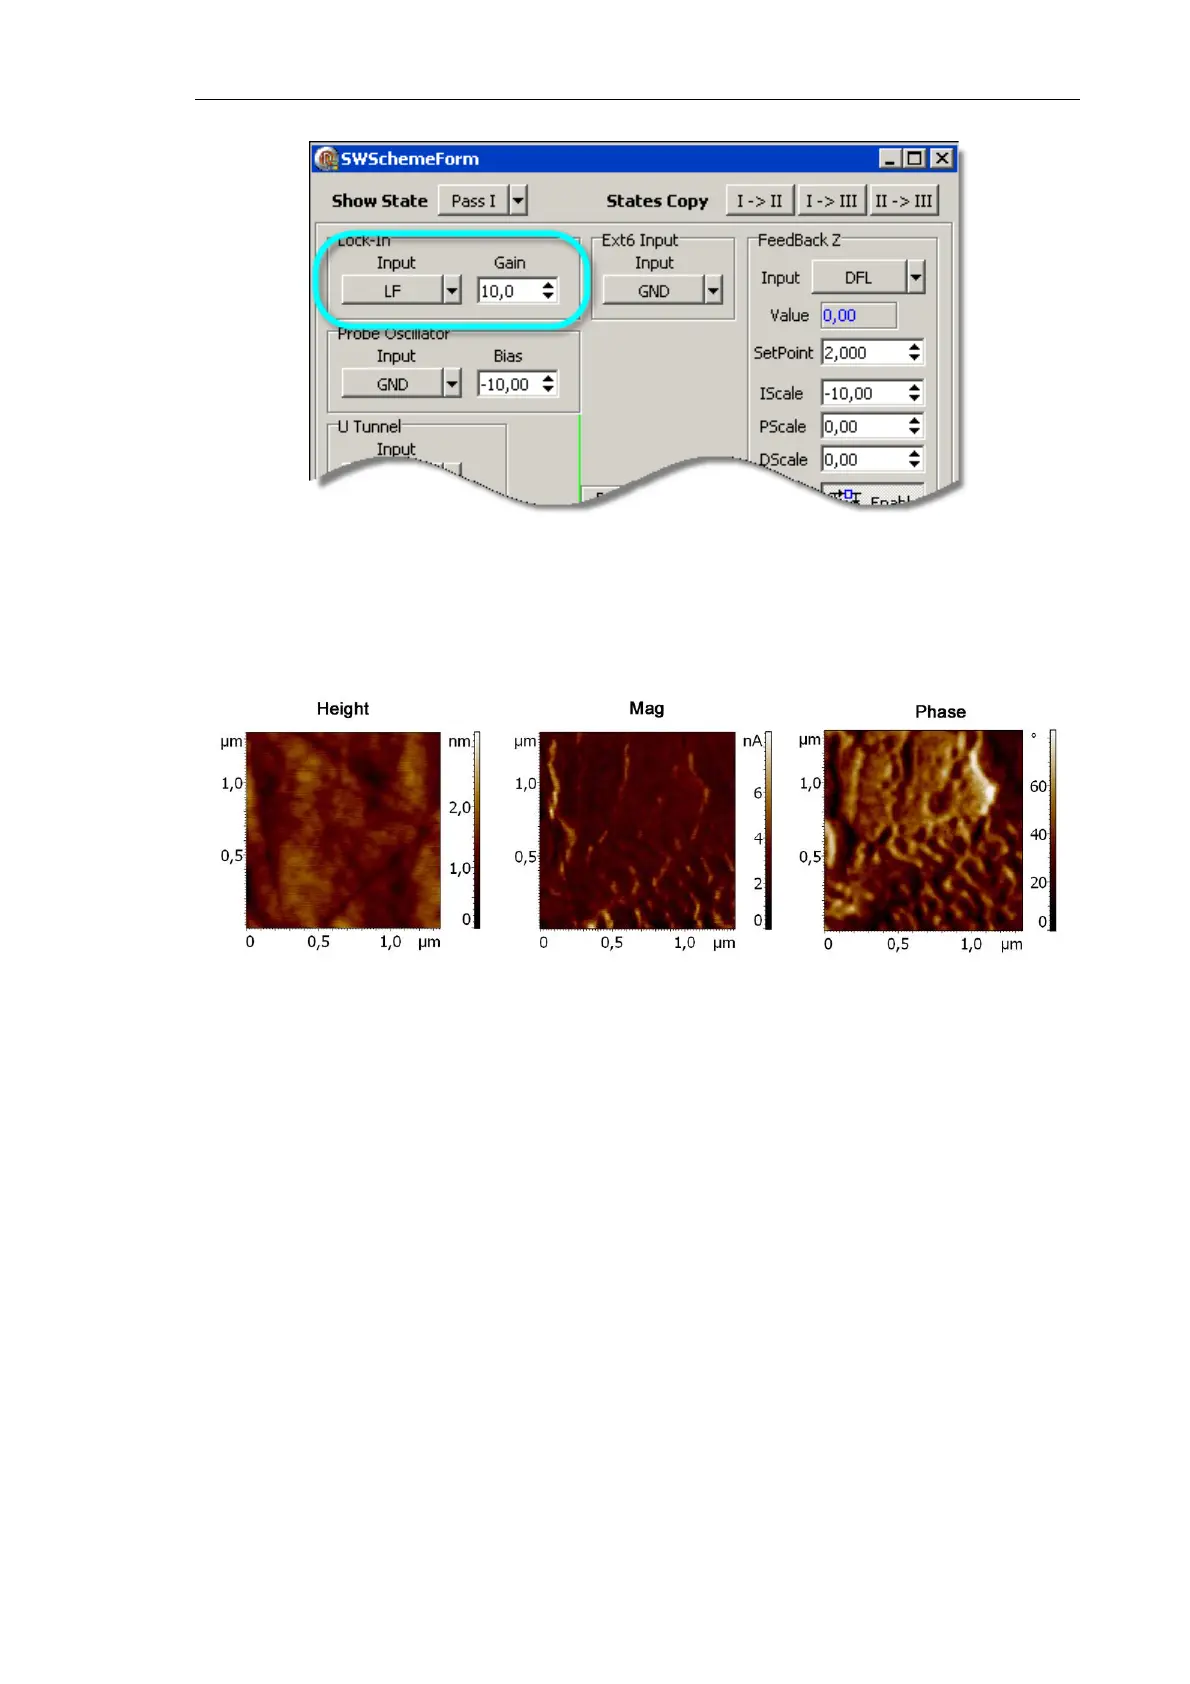
the second image of the scanning 2D data visualizes the distribution of the lateral
oscillations amplitude, while the third image is the distribution of lateral phase (Fig. 7-42).
Fig. 7-42. Images of the surface under investigation