5-12
VIBXPERT II 05.2012
Shaft centerline plot
A shaft centerline plot records the movement of the shaft axis* in a
journal bearing while the machine is running up or coasting down
(e.g. turbine). Conclusions can be drawn from the shaft centerline
plot on the fault conditions - such as oil whirl or oil whip in journal
bearings.
A description of the measurement procedure with VIBXPERT can
befoundintheTechnicalInformationCM#18'Analysisofradial
shaft movement in journal bearings’ - available free on our website.
A shaft centerline plot can be set up via the following task:
2-channel coastdown - phase, meas. quantity: displacement
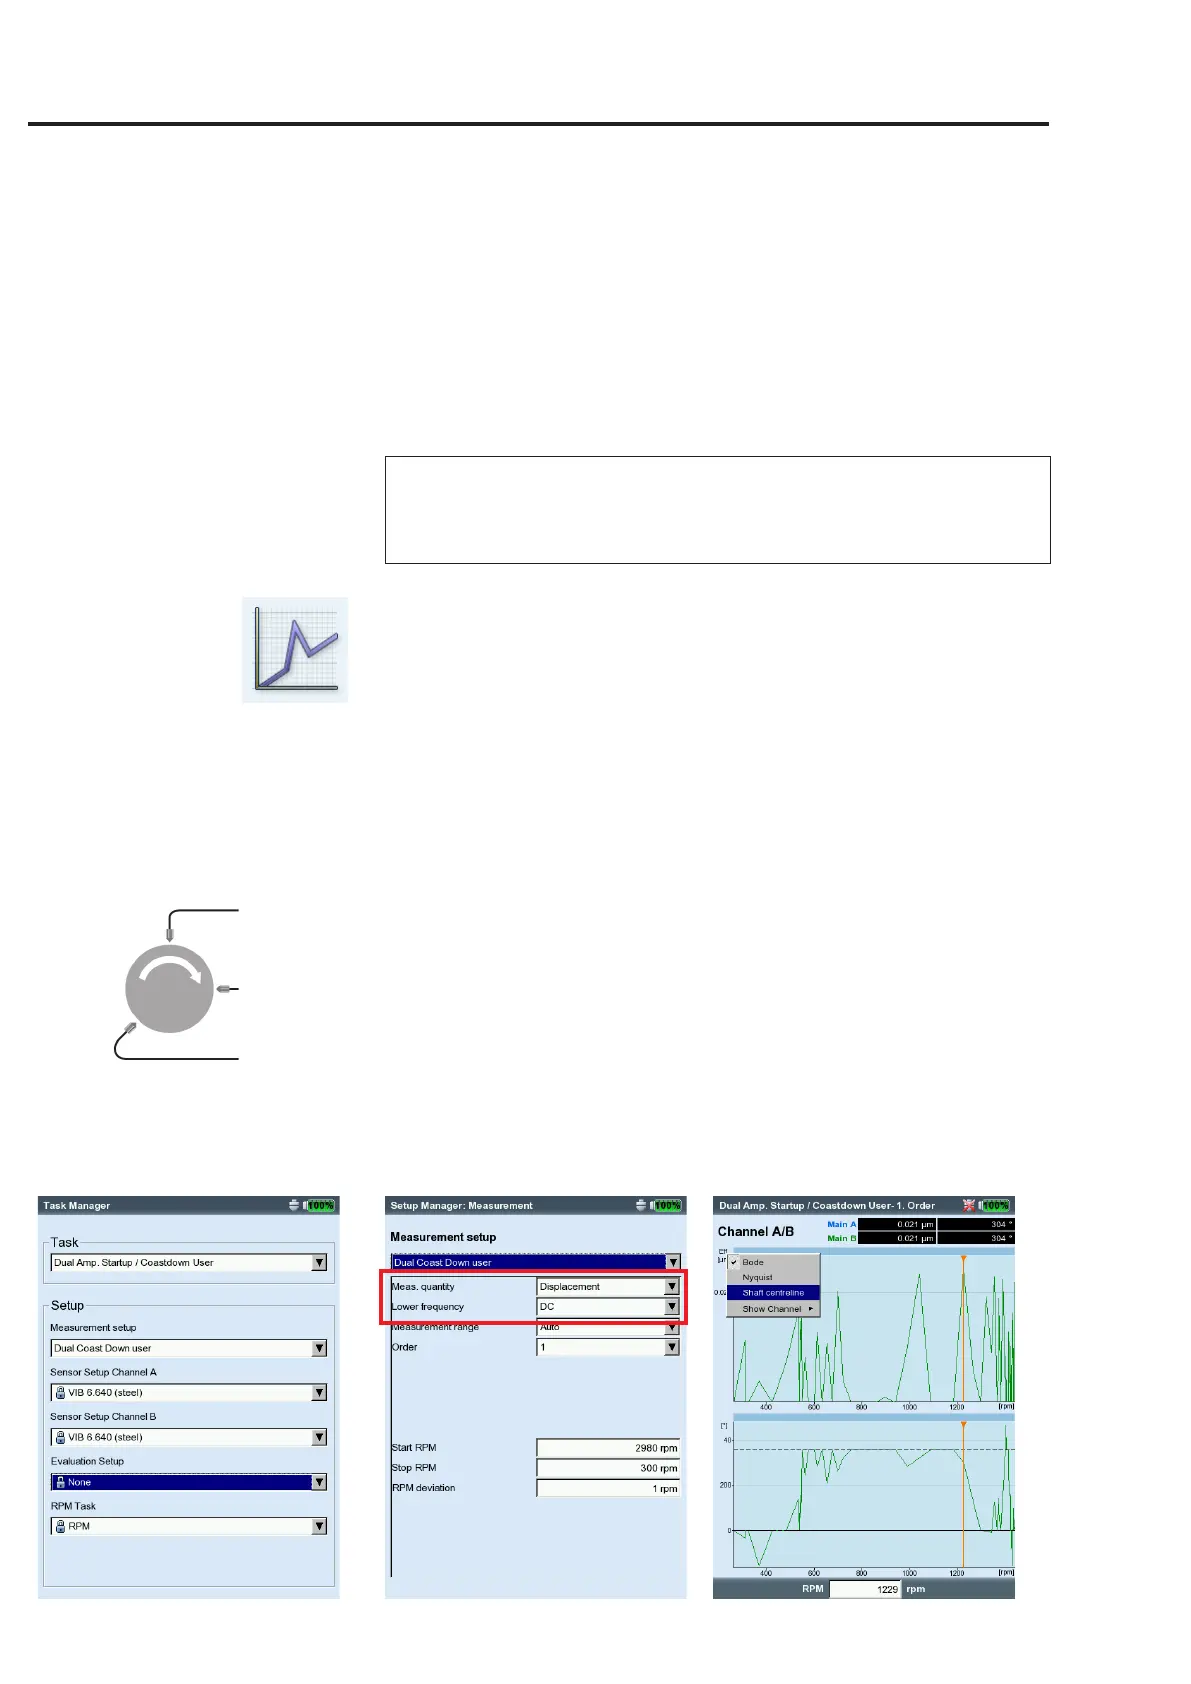
Parameters set up in the measurement task manager (see below)
• As the measurement task, select 'Dual Amp. Startup/Coastdown
User'(seep.5-7).
• Asthemeasurementsetup,select'DualCoastDownUser'.
• Setthefollowingparametersinthemeasurementsetup:
-
measurement quantity = Vibration displacement
-
lower frequency = DC
• In the sensor setup, select the displacement sensors (e.g. VIB
6.640).
Requirements for correctly interpreting the results
- Thesensorsareinstalledatanangleof90°toeachother.
- The shaft always turns from sensor A to sensor B. The position of
the sensor relative to the direction of rotation can be adjusted after
measurement.
- The static shaft position can be displayed as an offset in the shaft
centerline plot.
* The movement of the shaft axis at a
constant rpm is recorded with an orbit
plot (p. 5-16).
Channel A
Channel B
RPM
Shaft centerline plot
Setups in the task manager Parameters in the meas. setup
Results display
Measurement tasks
Note
 Loading...