4-3
VIBXPERT II 05.2012
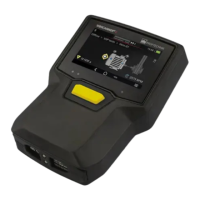
Left:
Delete measurement
Right:
Trend diagram
Results
Characteristic overall values - trending
If more than two measurements are saved in a file, the results for each
overallvaluearedisplayedasatrendcurve(seep.3-28f).
Markers on the trend curve indicate each individual measurement.
The measurement values at the cursor position, the date, the rpm if
applicable, and assigned events and comments are specified below
the diagram. Use the F key to display the individual results.
Withtheaidofthedisplayedthresholdline(seep.3-25),itispos-
sible to determine if thresholds have been exceeded. If more than one
overall value appears in the diagram, only the threshold for the high-
lightedvalueisdisplayed(inthebelowscreen:upperalarmforRMS
value). Press the navigation key up / down to mark the other overall
values and display the respective threshold values.
Zoom
Press the '+' button repeatedly to magnify the area around the cursor.
This process can be undone again with the 'Minus(–)' key.
The bars above a diagram show the displayed range relative to the
entire display range.
Deleting individual measurements
If a spurious measurement has been included in the trend, delete this
as follows:
• Highlightthemeasurementinthetrendwiththecursor.
• PresstheMENUbutton.
• Clickon'Delete'.
0-p
Zoomed area
Thresholds for RMS value
RMS