79
Global information regarding the process:
Information Description
PAUSE
Dosing process inhibited by
(pause) button.
COMPLETED Dosing process completed.
ABORTED
Dosing process aborted by
(stop) or (breakdown) button.
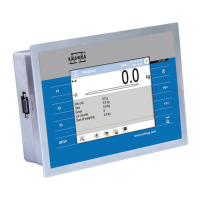
29.4.2. Dosing Bar Graph
Dosing bar graph operation differs depending on the following dosing modes:
• automatic 1-stage dosing,
• automatic 2-stage dosing,
• manual dosing.
Automatic 1-stage dosing:
• Visualisation of mass value lower than the value of [DT2] threshold:
• Visualisation of mass value higher than the value of [DT2] threshold:
Automatic 2-stage dosing:
• Visualisation of mass value lower than the value of [DT1] threshold:
• Visualisation of mass value higher than the value of [DT1] threshold and
lower than the value of [DT2] threshold:
DT1=0.000kg
DT2=1.800kg
DT1=0.000kg
DT2=1.800kg
DT1=1.600kg
DT2=1.800kg
DT1=1.600kg
DT2=1.800kg

 Loading...