RADWIN2000D+UserManual Release3.6.00 20‐6
RunningSpectrumView Chapter20
IfitisacceptabletodroptheserviceclickYes.Theprocessingma yappeartohavestopped‐
butitisnotcompleteuntilalloftheShowbuttonsforlinkareenabled.
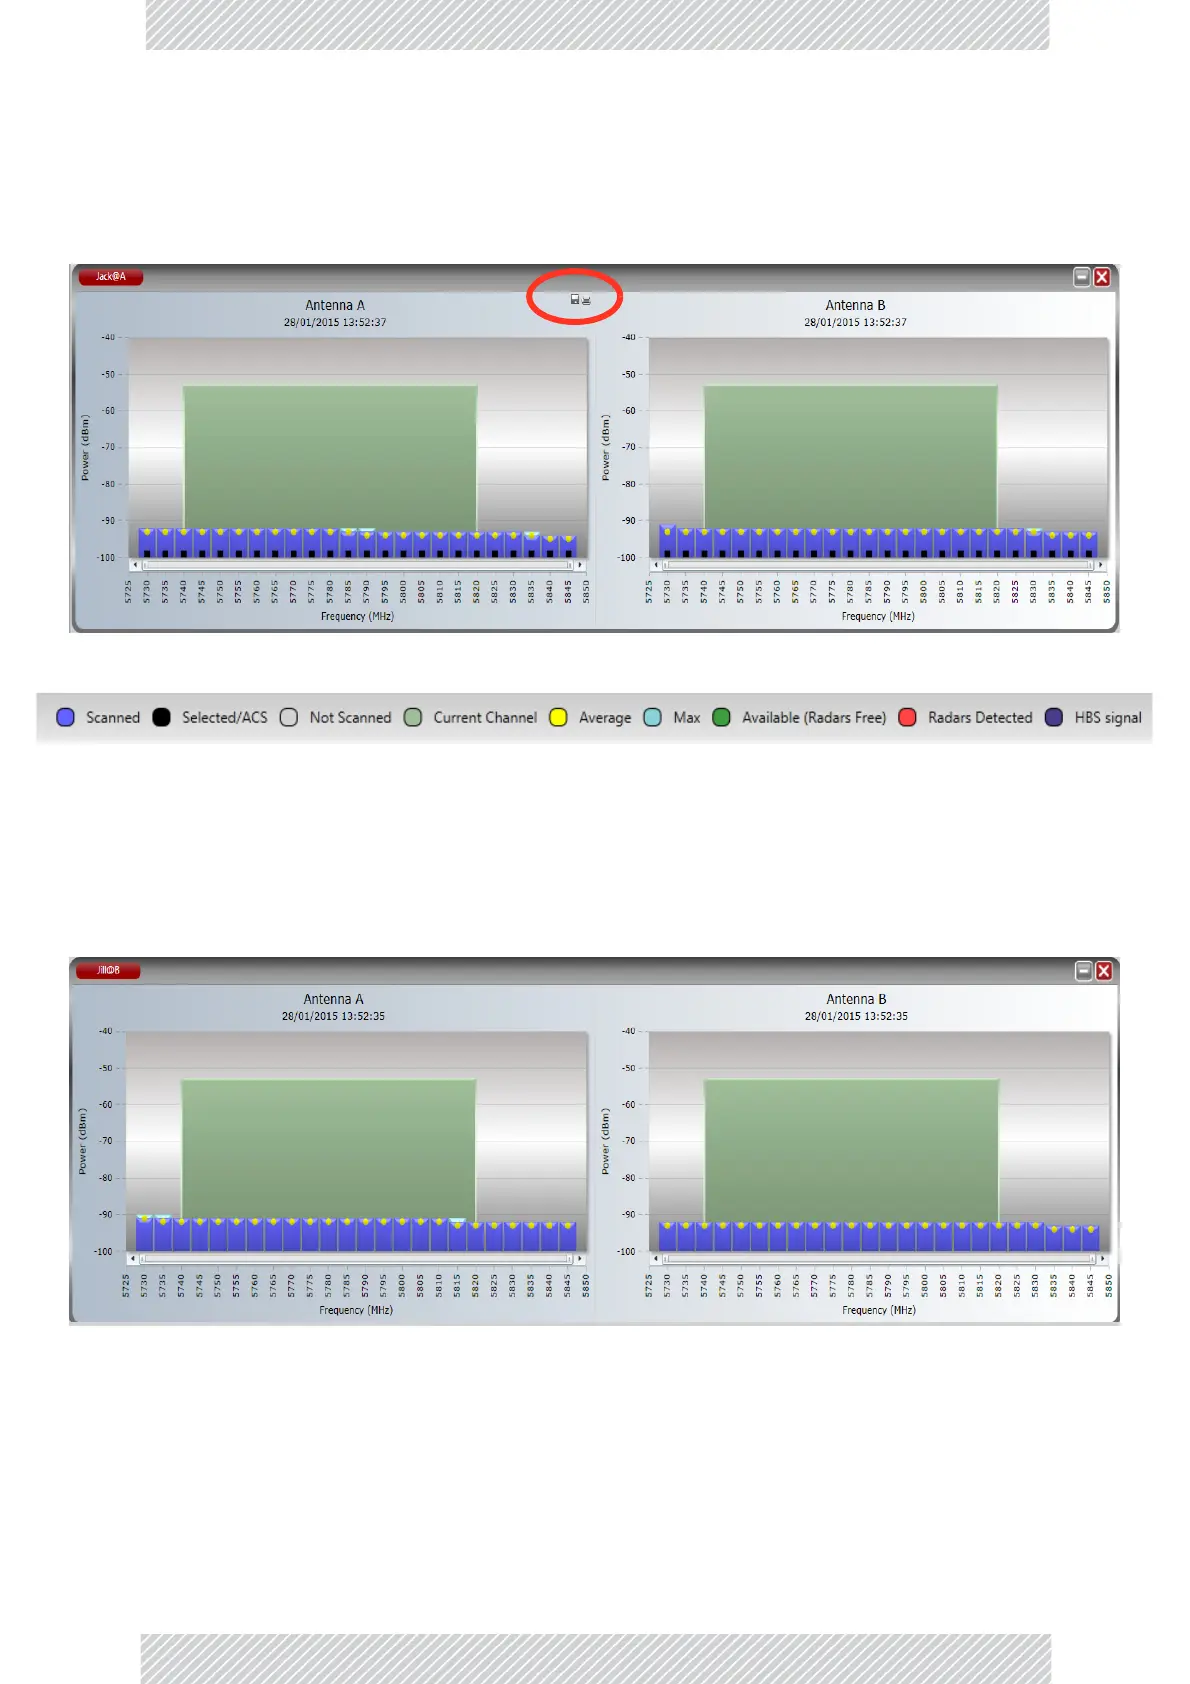
HereistheresultfortheRT‐A(HBS):
Thek eystothecolorcodingispermanentlydisplayedatthebottomofthemainwindow:
Figure20‐1:SpectrumViewAnalysiscolorcodes
ThegreenbandreflectsthecurrentMasteroperatingfrequency.Noticealsothesmallfly‐
overdisketteicon(circled)totheupperleftofeithergraph.ClickingitopensaWindowsFile‐
Savedialogallowingyoutosavethegraphtodiskasajpgfile.
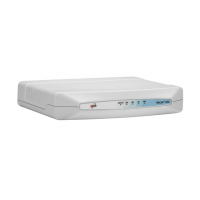
HereistheanalysisforRT‐B(HSU).Itisverysimilar:
Thelightgreenrectangleinthebackgroundofbothantennadisplaysreflectsactualchannel
(20MHzwidehere)beingusedbytheSlave.ThetitlebaralsocontainstheSlave’sIPaddress.