User Interface
R&S
®
GP-E/GP-S
31User Manual v16.2.1 ─ 01
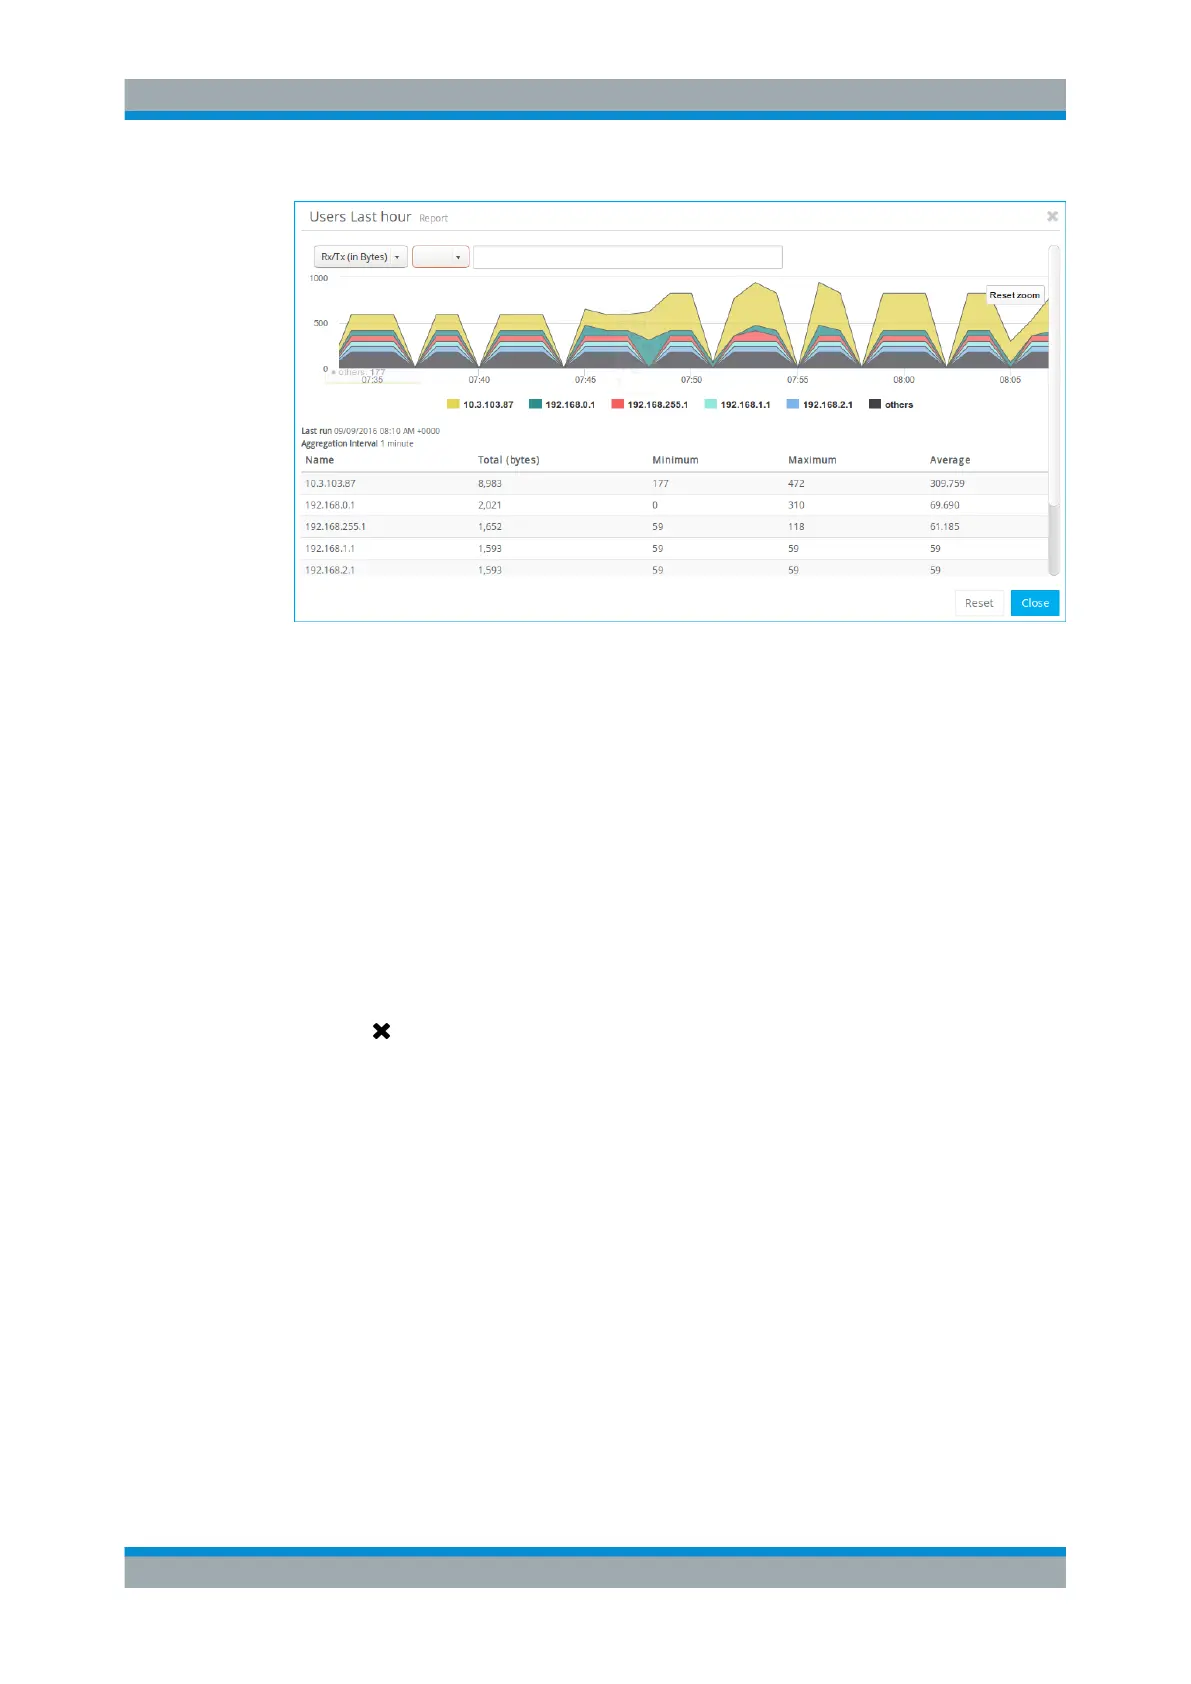
Figure 3-5: Sample users report.
Reports typically contain drop-down lists that can be used to adjust the data displayed
in the report and the quantity or »depth of interest« in the report data. For example, a
traffic volume report may have an option to display the traffic in incoming ( "Rx" :
received), outgoing ( "Tx" : transmitted) or total bytes and may also have a selection for
the top users or zones (depending on the report).
Additionally, the data to be displayed in a report can be filtered by name. There are two
options:
●
By clicking the search field above the chart, you are offered a selection of items
included in the report. You can also type in the search field, getting a list of items
whose names contain the characters you are typing. The first option or match is
highlighted in the list. Press ENTER to select the item or use the arrow keys on
your keyboard to select a different item. To delete an item from the search field,
click on the left side of the item.
●
Filtering by name can also be performed by clicking items in the legend below the
chart to activate and deactivate them in the report.
A mouse-over provides details on a specific point in the graphical report. A click with a
dragging motion selects an area within the graphical report for higher granularity. Upon
click-and-drag, the graphical report then redraws itself with the selected areas of detail
as the new display parameters. To return to the default graph, click "Reset zoom" in
the upper right corner of the chart.
Reports include a legend. The legend is color-coded and is ordered to reflect the rela-
tive quantity displayed in the report (left to right, top to bottom). For example, the leg-
end for a report showing the top users in bytes would have the highest user first (far
left, or listed first).
The sections below provide further information on the data available in each type of
report.
Menu Reference