MASTER STC
USER MANUAL
60
19 PERFORMING MEASURES: MEAS
The MASTER STC is equipped with one LCD [C] display.
Refer to the Chapter 10 SIGNAL TUNING: PLAN at page 20 to tune the desired channel.
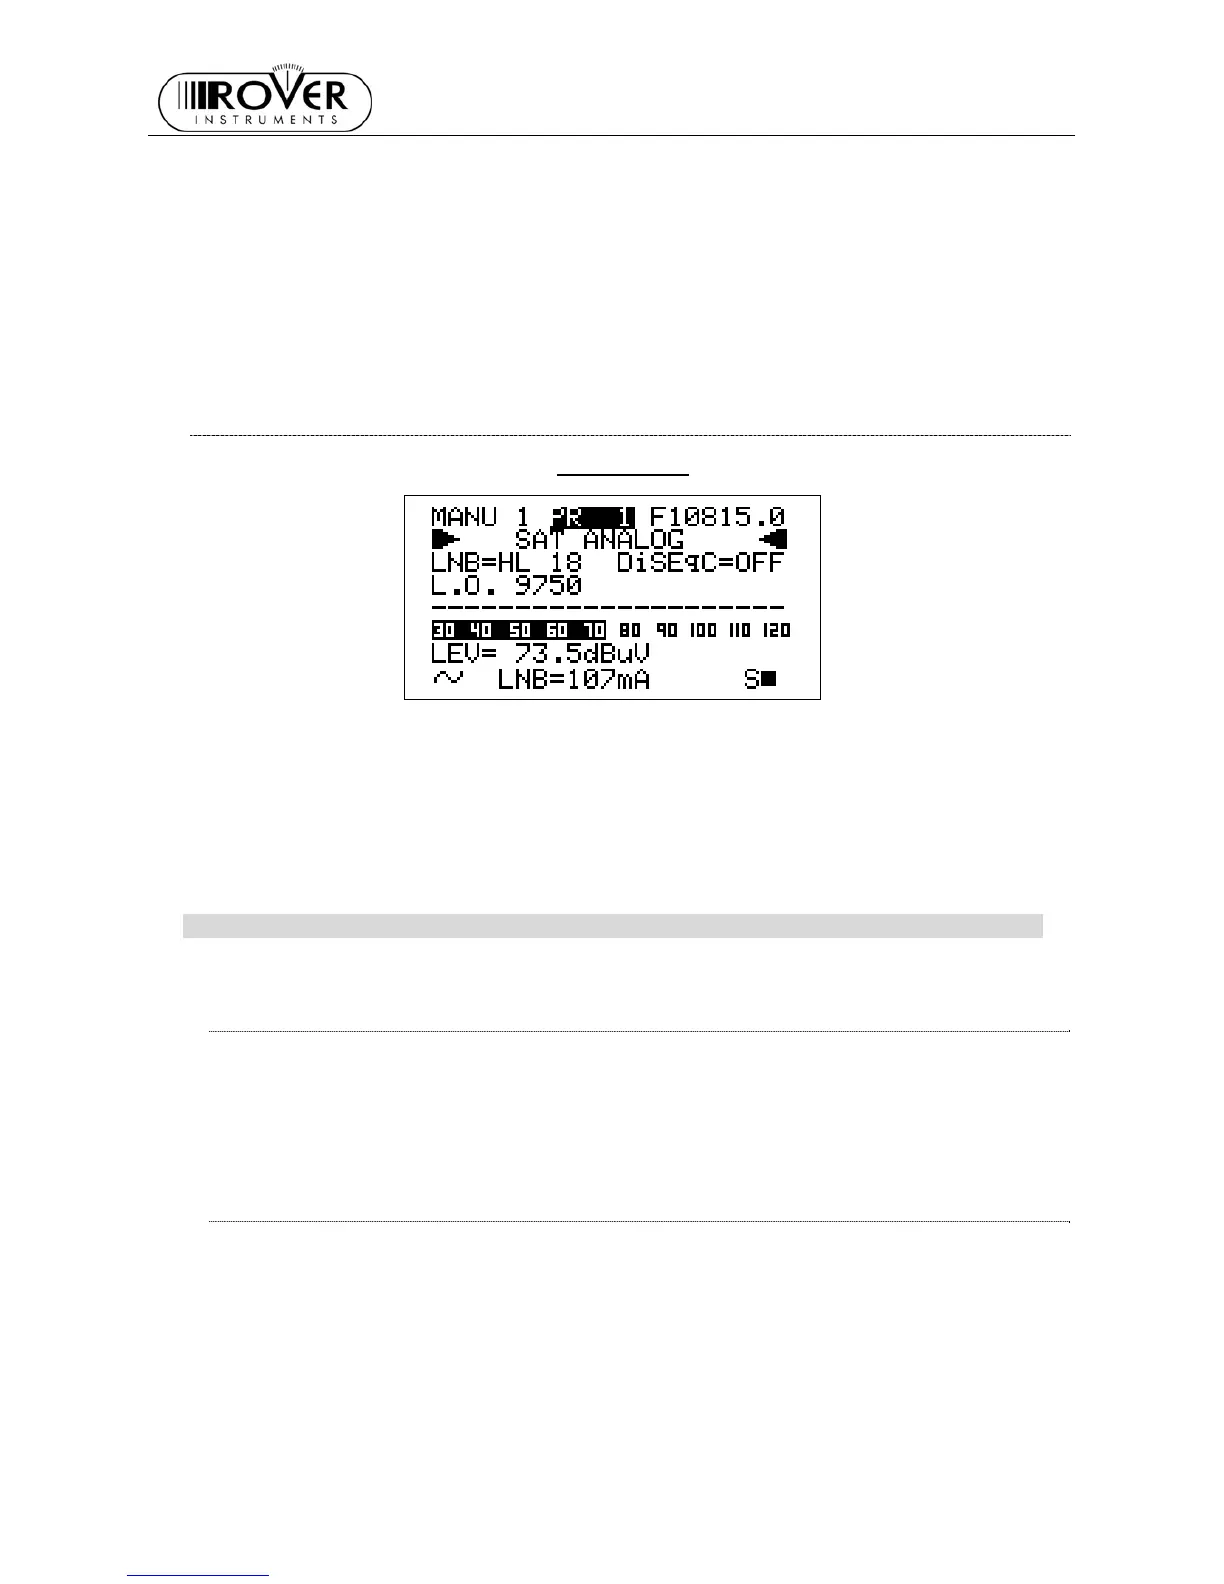
19.1 ANALOGUE TRANSPONDERS
The LCD second row shows the item SAT ANALOG.
On the next rows :
• Polarization and high/low band (third row, on the left)
• DiSEqC status (third, on the right)
• Local Oscillator frequency (fourth row, on the right) are displayed.
The LCD bottom row displays on the left the power supplied to the antenna LNB ; on the
right, a “S” icon and a black filled quadrangle are displayed in correspondence to the
items SAT and AN.
VIDEO SIGNAL PEAK LEVEL MEASUREMENT
The LCD bottom row shows the current video signal peak level together with the
relevant measurement unit. The video signal peak level real time value is also displayed
on a level bar with peak level memory. The level bar displays an horizontal bar showing
the maximum level (peak level) reached by signal during the measurements.
SPECTRUM ANALYSIS OF THE TUNED CHANNEL
Refer to Chapter 20 SPECTRUM ANALYZER MODE at page 65.