C.2 OTT Profile Health Timeline
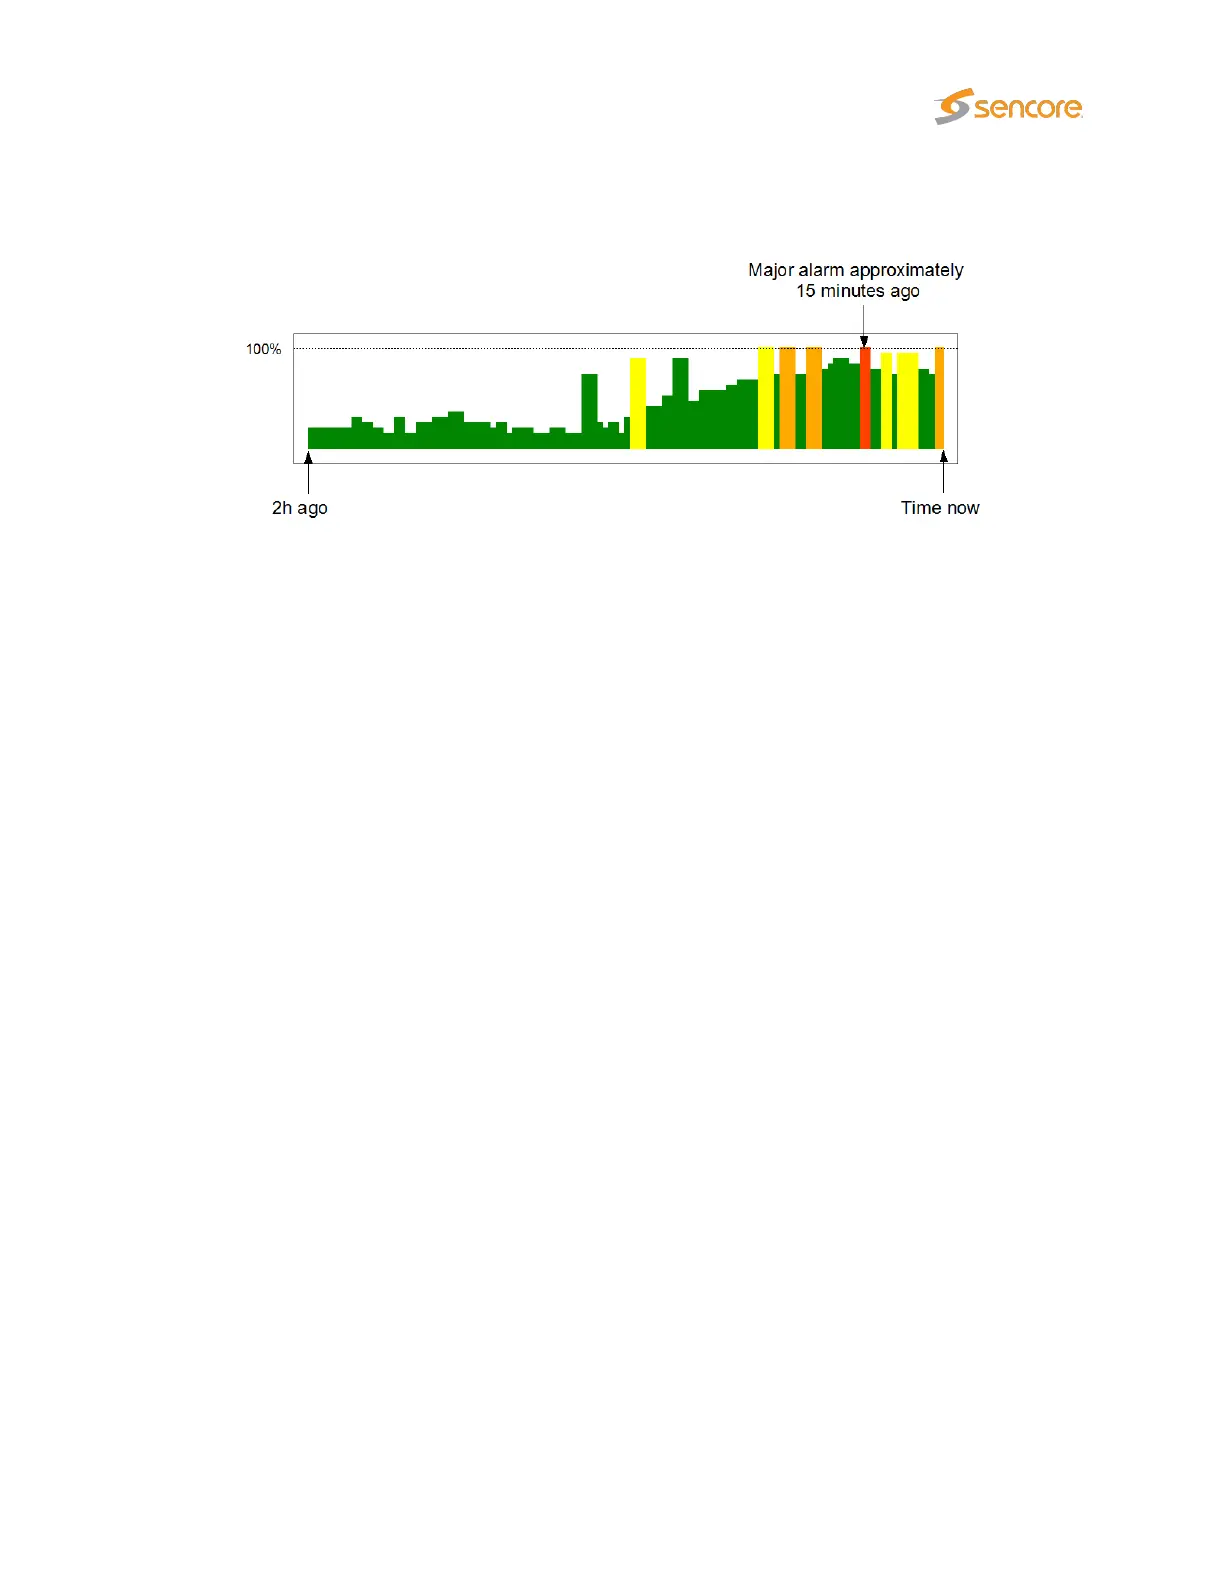
The OTT profile health timeline shows information about channel bitrate and channel alarm status for the
last two hours, with a time resolution of one minute. Green parts of the timeline indicate profile download
time versus chunk length. The graph is scaled so that 100% indicates a chunk download time identical to
chunk length (in seconds), chunk length being signaled in the profile manifest. Quick chunk download
times therefore result in a ‘low’ green graph, as seen in the left hand part of the graph above. When
download times exceed the user defined profile bitrate warning and error thresholds the graph is colored
yellow and orange respectively.
In addition to profile bitrate indication the graph displays profile status information related to non-bitrate
alarms. Active profile alarms are represented in the graph as 100% bars, the color reflecting the severity
of the alarm. If several alarms are active within a one minute period the graph color will reflect the most
severe alarm. Historical alarms can be examined in more detail by viewing the OTT alarm list.
VB2xx GigE User’s Manual version 5.4 261