6.9.5 ETR 290 — Bitrates
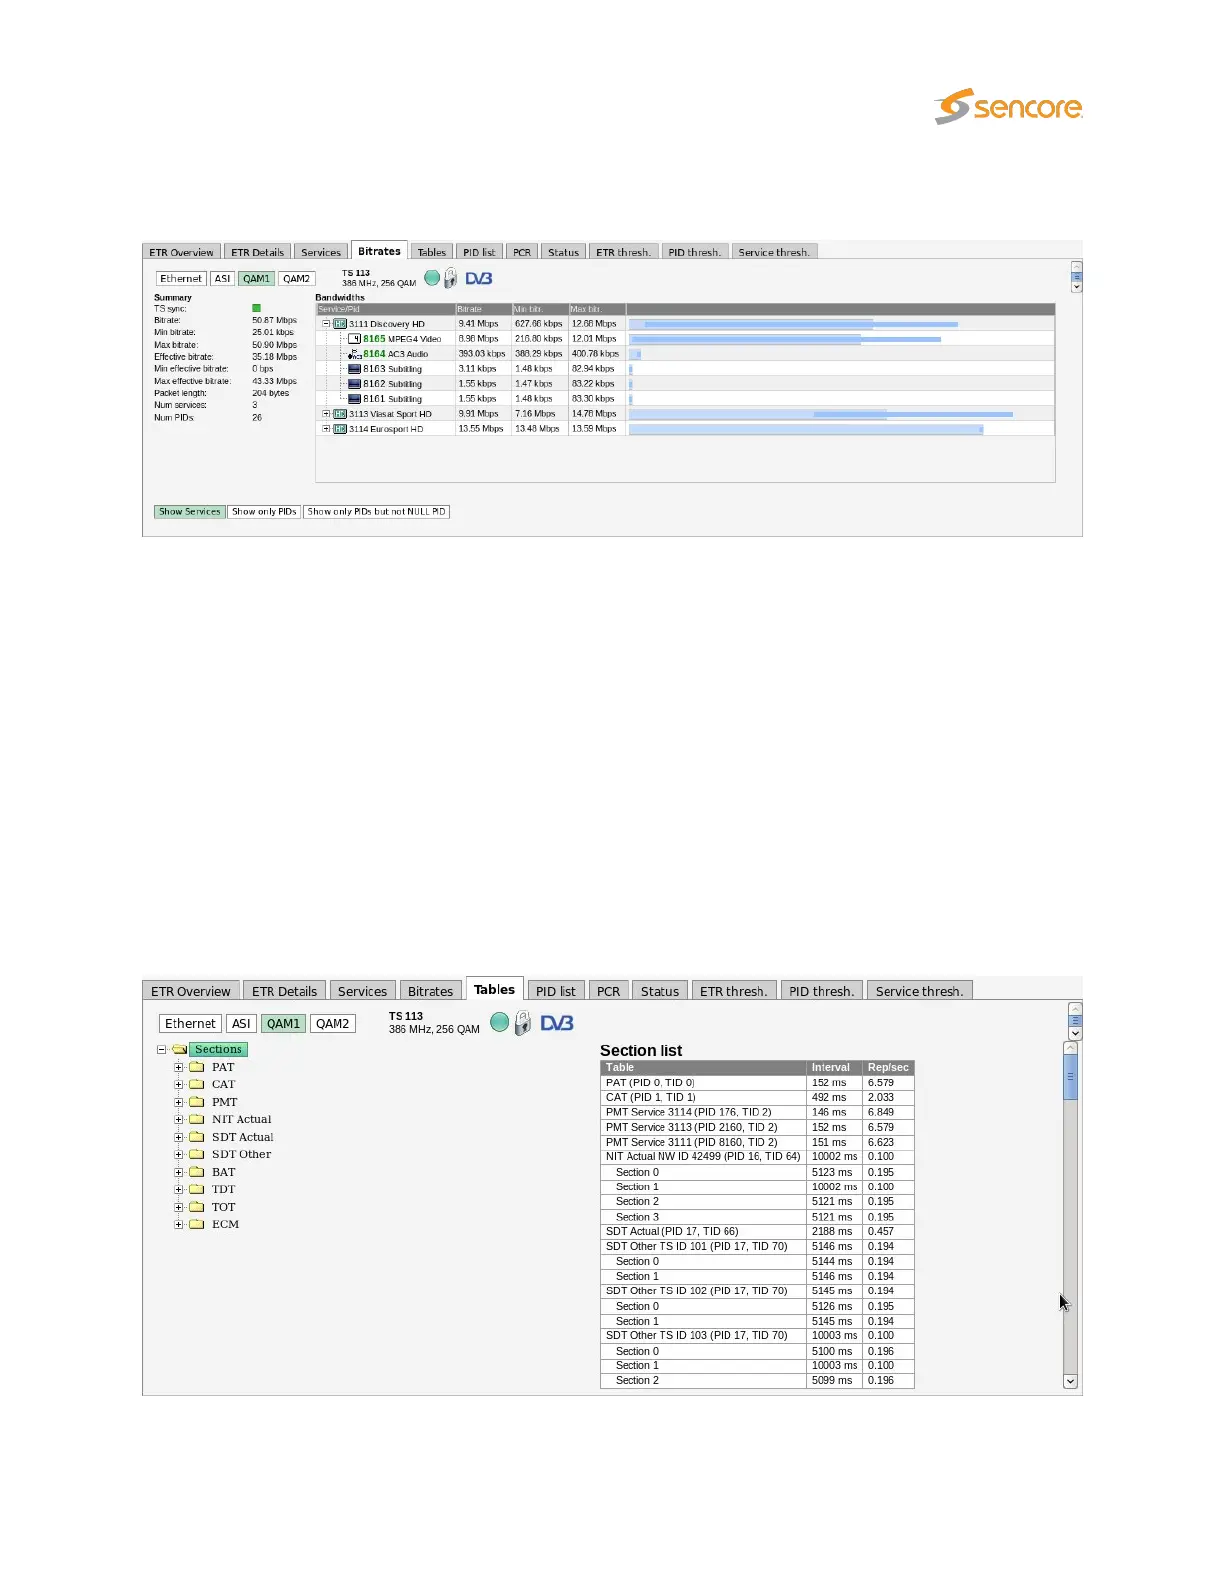
This view shows a graphical representation of service and PID bitrates. The current bitrate is shown as
the length of the light blue bar whereas the dark blue bar represents bitrate variation, spanning from
minimum to maximum measured bitrate.
The name of the current stream is displayed in addition to the two round-robin indicator icons when
relevant: the time cycle icon and the lock icon. By clicking the lock icon the round-robin tuning process is
stopped (locked to the current frequency) or resumed. A DVB or ATSC icon indicates the analysis mode.
The analysis mode is defined as part of the ETR thresholds.
The user may select to view either a list of services and component PIDs, to view PIDs only or to view
PIDs without the null PID. This is selected by clicking the
Show Services
,
Show only PIDs
or
Show
only PIDs but not NULL PID button respectively.
6.9.6 ETR 290 — Tables
VB2xx GigE User’s Manual version 5.4 135