Operation
4.3 Display
Operating with the Local User Interface
64 Operating Manual, 06/2017, A5E31930478-05
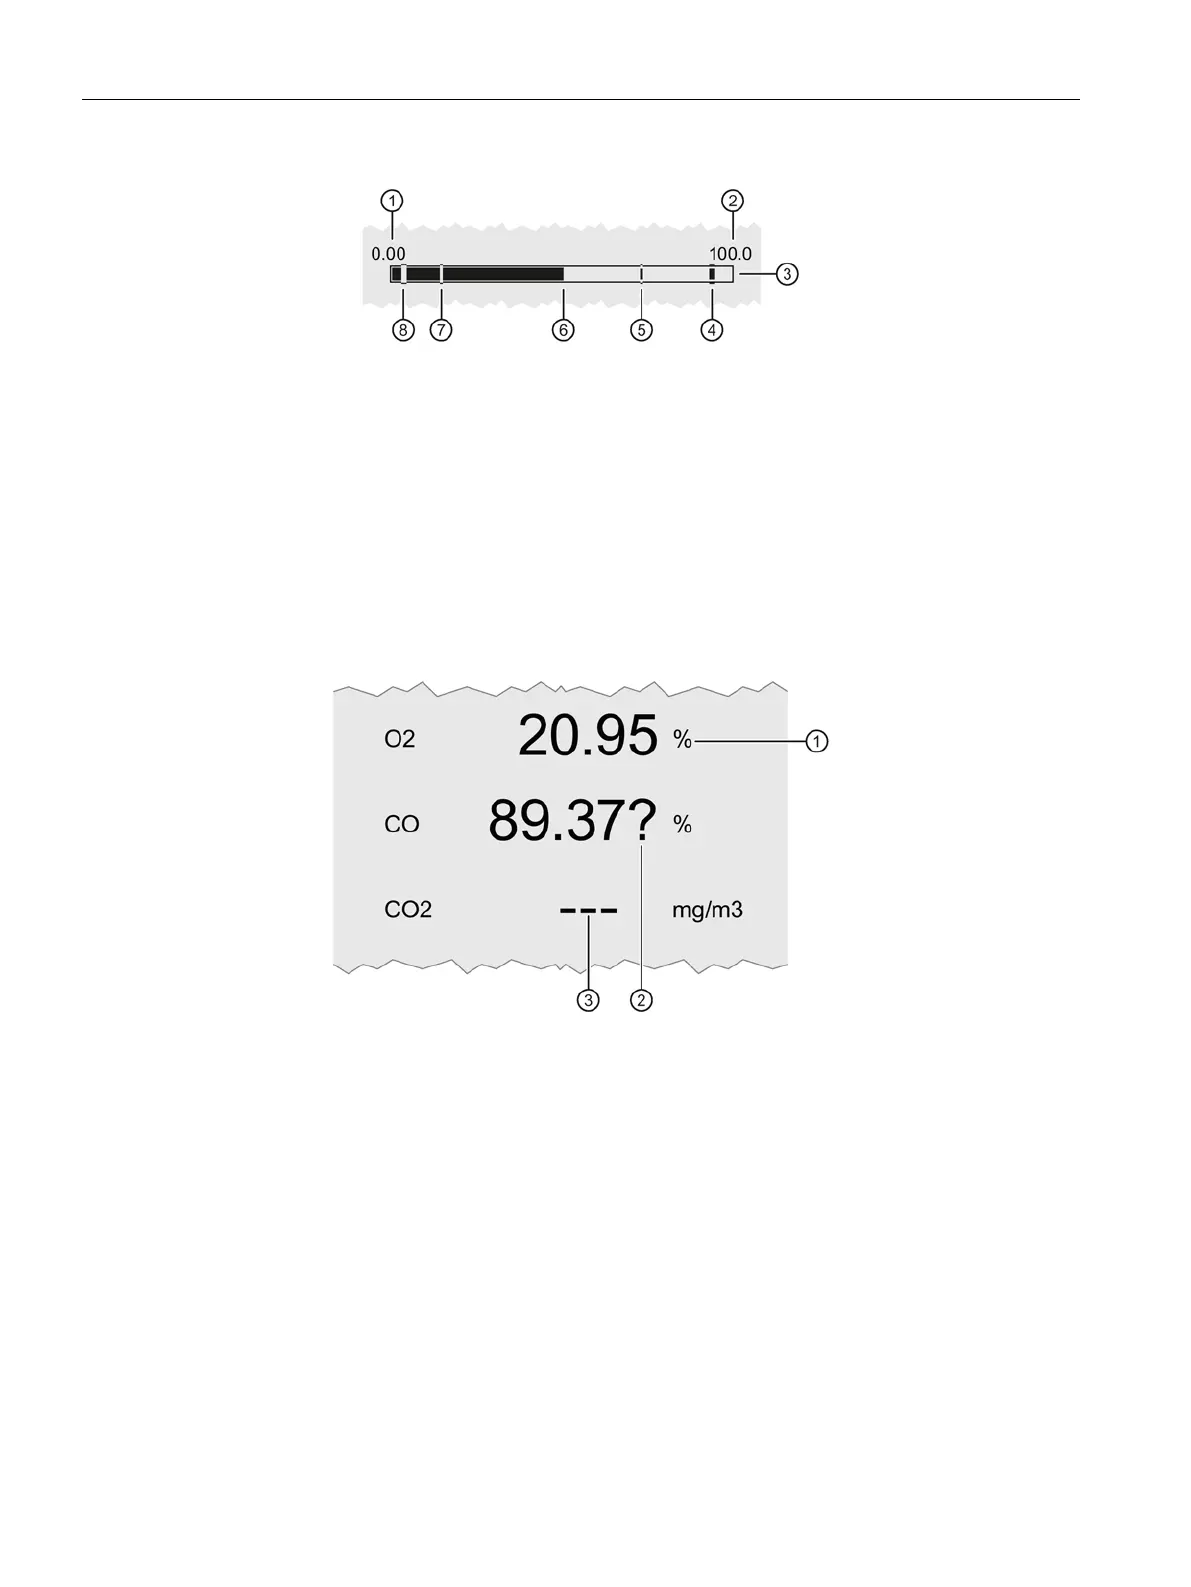
Figure 4-8 Example: Bar graph for measured-value display with display of measuring range limits
If not more than two components are displayed, the device displays measuring range limits
including high and low warning and alarm limits as bar graphs. The current measured value
in the example is 50% of the measured value.
Numerical value with unit, no qualifier displayed ⇒ Measured value status: "Good"
Numerical value with qualifier "?" and unit ⇒ Measured value status "Uncertain"
No numerical value displayed any longer, qualifier "- - -" ⇒ Measured value status "Bad"
Figure 4-9 Example: Display of measured value status
If a measured value reaches the measured value status "Uncertain" or "Bad", a "?" is
displayed behind the measured value. Measured values that can no longer be displayed are
displayed as "- - -".
 Loading...