Time plots
The system can present data history in different plots. The plots can
be displayed in full page, or combined with other panels.
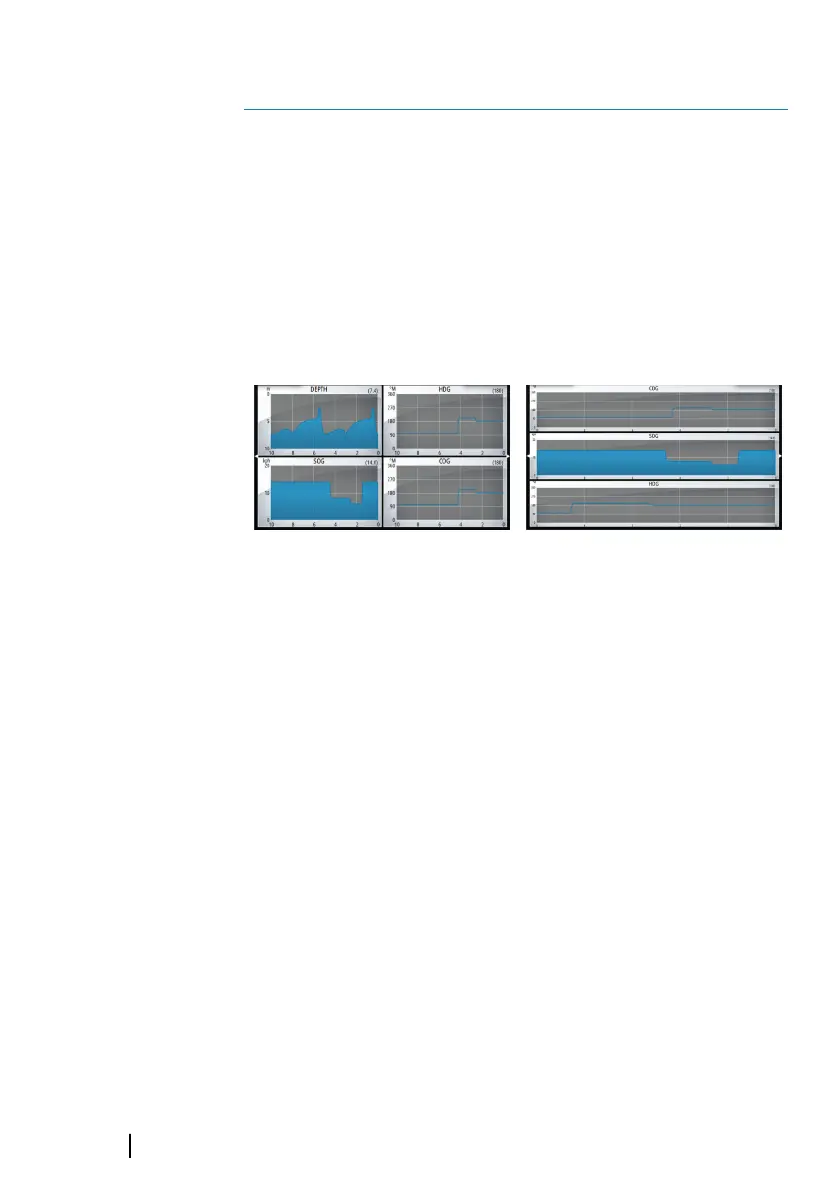
The Time plot panel
The Time plot panel consists of two predefined layouts. You switch
between the layouts by selecting the left and right panel arrows.
You can also select the layout from the menu.
You can select which data to present on a time plot panel, and you
can define the time range for each plot.
Layout 1 Layout 2
Missing data
If the data is unavailable, the relevant plot turns into a dashed line
and flattens out at the point the data was lost. When the data
becomes available again, a dashed line joins up the two points
showing an average trend line bridging the missing data.
Missing data
If the data is unavailable, the relevant plot turns into a dashed line
and flattens out at the point the data was lost. When the data
becomes available again, a dashed line joins up the two points
showing an average trend line bridging the missing data.
Selecting data
Each data field can be changed to show the preferred data type and
the time range.
1. Select the edit option from the menu
2. Activate the field you want to edit
3. Change the information type and eventually the range
4. Save your changes
21
196
Time plots | GO XSE/XSR Operator Manual