Ú
Note: SonarChart live does not record while SCL history files are
being viewed.
SC Density
Controls the density of the SonarChart and SonarChart Live
contours.
Colored seabed areas
Turns ON/OFF coloring seabed areas red.
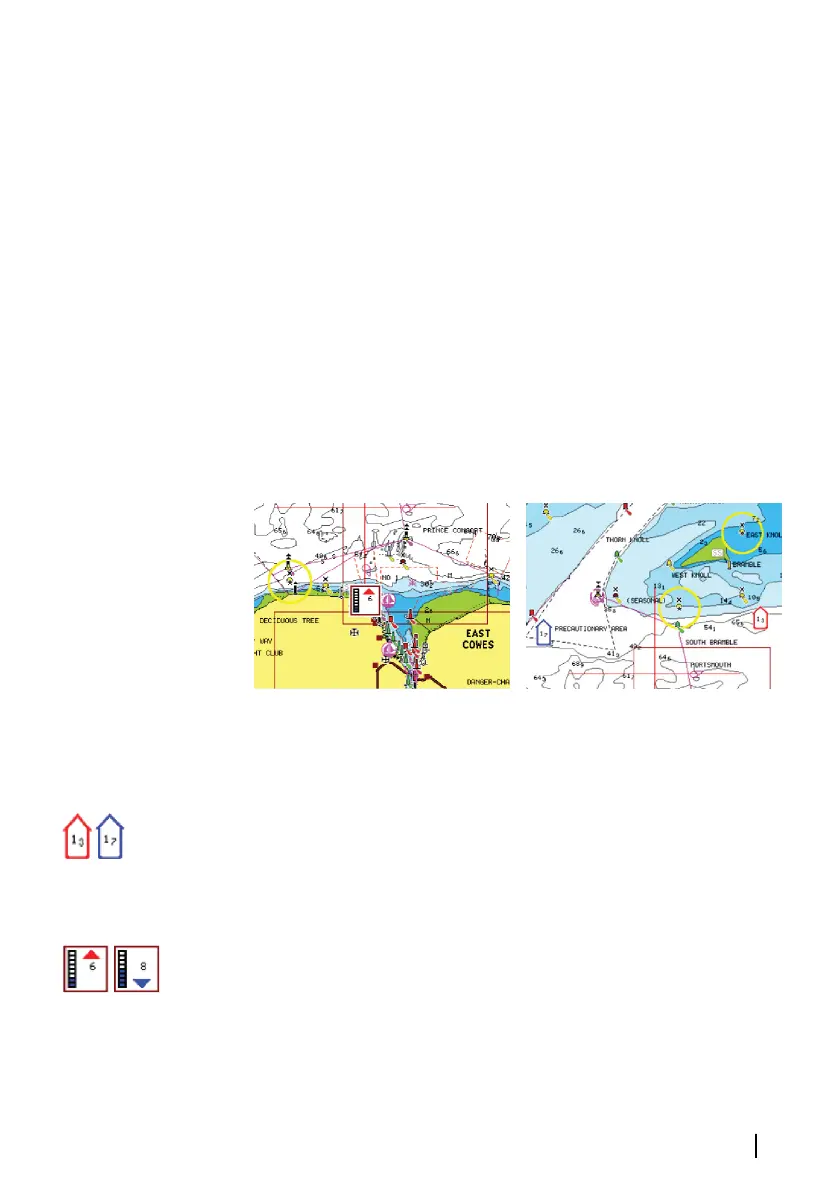
Navionics Dynamic tides and current icons
Shows tides and currents with a gauge and an arrow instead of the
diamond icons used for static tides and current information.
The tide and current data available in Navionics charts are related to
a specific date and time. The system animates the arrows and/or
gauges to show the tides and currents evolution over time.
Dynamic tide information Dynamic current information
The following icons and symbology are used:
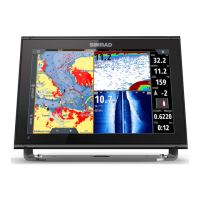
Current speed
The arrow length depends on the rate, and the symbol is rotated
according to flow direction. Flow rate is shown inside the arrow
symbol. The red symbol is used when current speed is increasing,
and the blue symbol is used when current speed is decreasing.
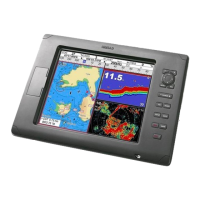
Tide height
The gauge has 8 labels and is set according to absolute max/min
value of the evaluated day. The red arrow is used when tide is rising,
and the blue arrow is used when tide is falling.
Ú
Note: All numeric values are shown in the relevant system units
(unit of measurement) set by user.
Charts | GO XSE/XSR Operator Manual
49