Wave User Manual 71
Version 4
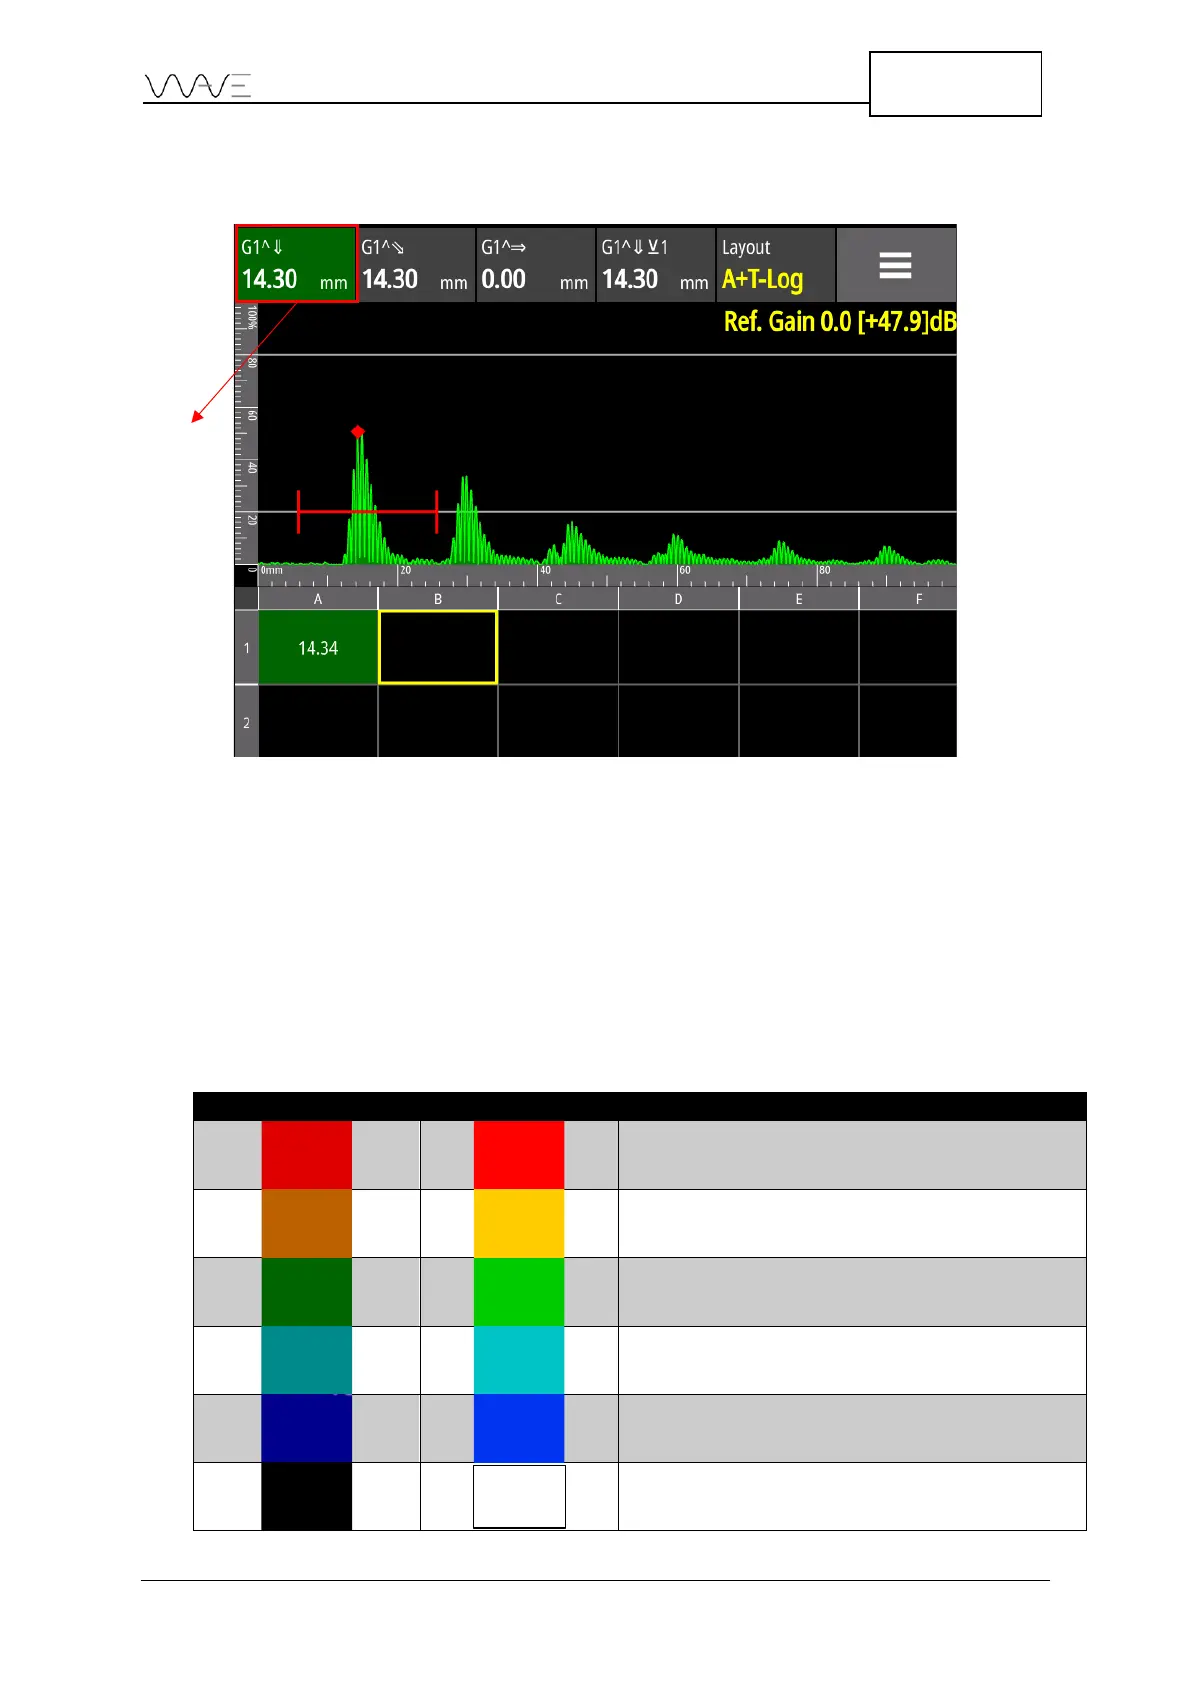
As indicated in Table 22, the measurement that will be logged in the grid is the first one
in the measurement bar from the left-hand side.
Figure 51 – The first measurement that is saved in the grid
12.7.2 Colour Palette
A cell can have up to six colour palettes. The following table features the colours based
on the Wave’s contrasts. The extreme values of each colour are identified.
Table 29 – Colour palette for the T-log