Wave User Manual 41
Version 4
Difference, in depth, between gate 3
peak and gate 4 peak measurements
Difference, in true depth, between
gate 3 peak and gate 4 peak
measurements
Difference, in surface distance,
between gate 3 peak and gate 4 peak
measurements
7.3 Measurement Values
Measurements are displayed as numbers. Usually these represent the FSH % or a
distance. There are exceptions though. Sometimes, a proper measurement cannot be
displayed. See below regarding the occurrences and reasons for not being able to see a
number of one of the measurement areas.
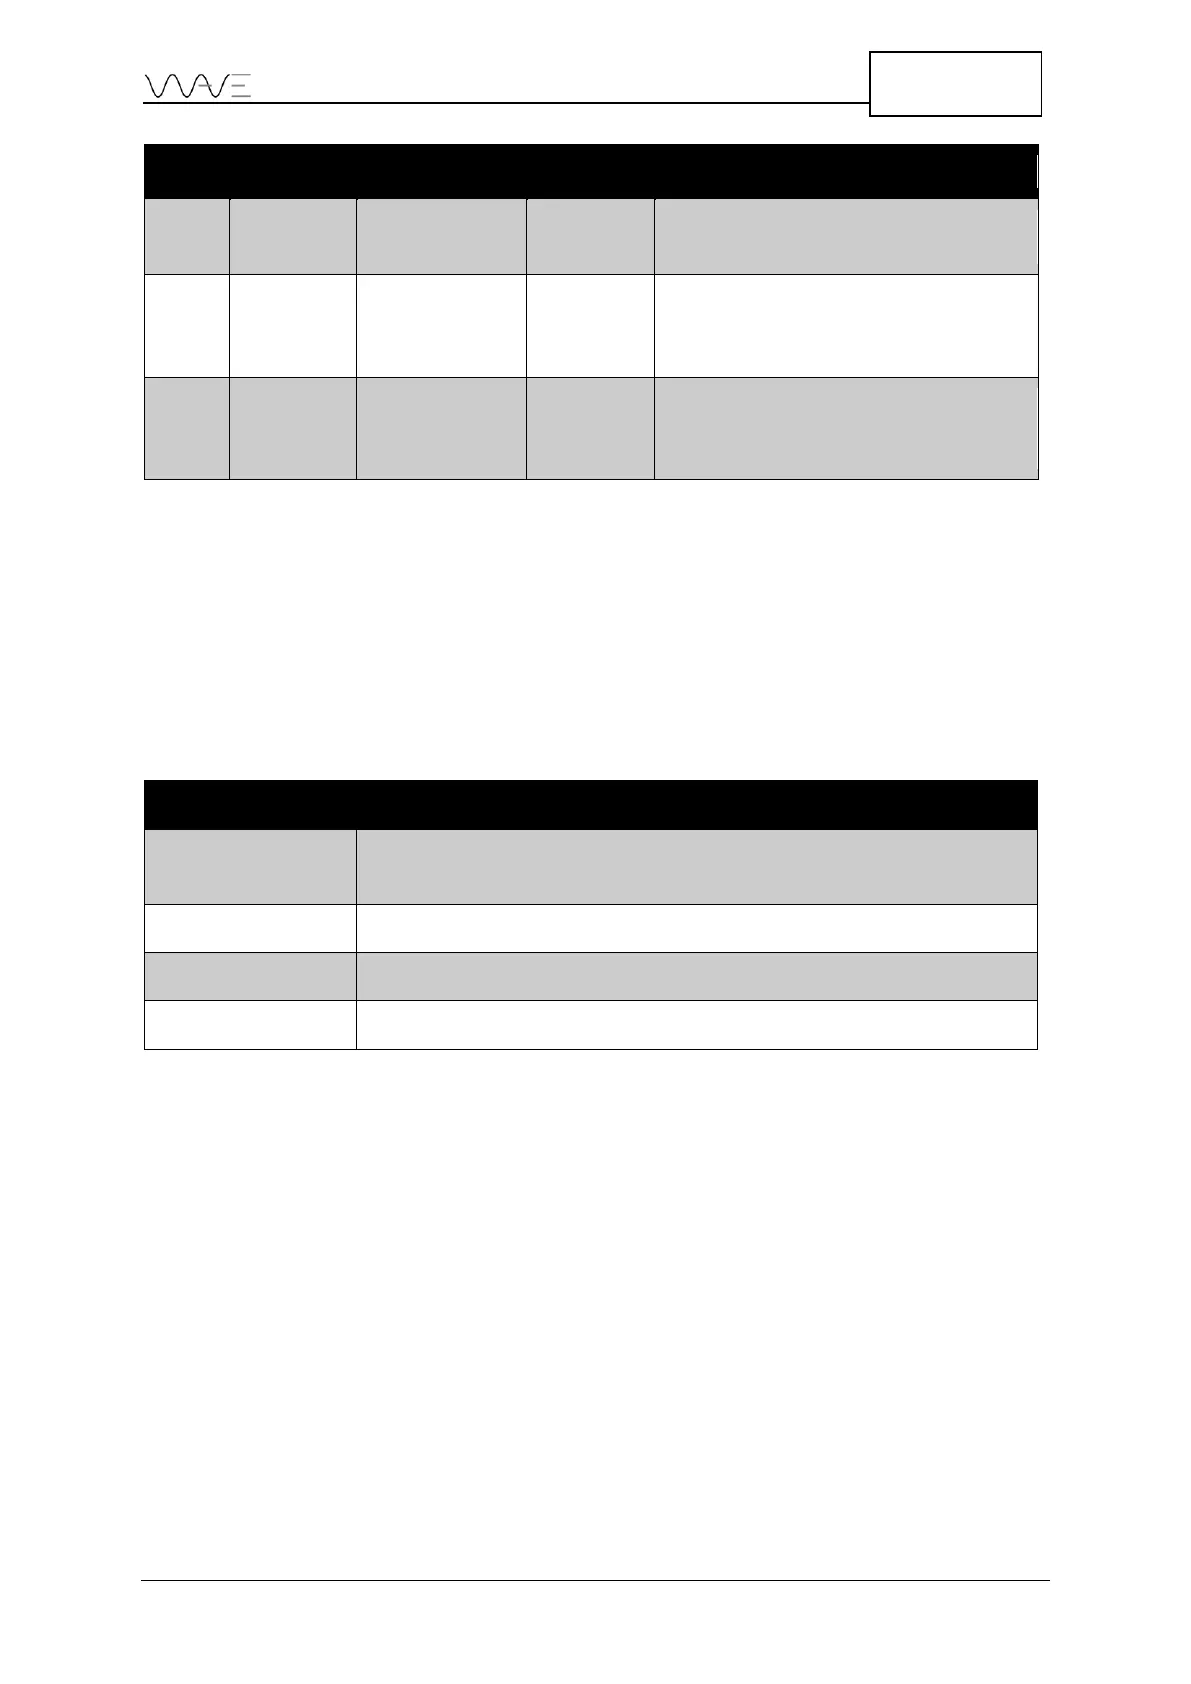
Table 12 - Measurement values
The value cannot be calculated because at least one of the required
conditions to compute it is missing.
Nothing is being measured (below 5% FSH)
A saturated reading, i.e. over 160% FSH
The normal condition: this is the value of the measurement
7.4 Measurement Coordinates References
Wave adds quite a few new capabilities for the inspection of complex parts. For example,
when inspecting T joints with fillet welds, the ray tracer will show the beam path travelling
everywhere in the part.