6. Units of the measured value.
7. Elapsed time shows the current second of the
measurement. The value presented there belongs
to the range [1, Integration Period].
8. File name when Logger is active (path: <Menu> /
Measurement / Logging / Logger Setup /
Logger:).
Notice: There is no displayed indication of the detector in case of Peak, P-P and Ovl results.
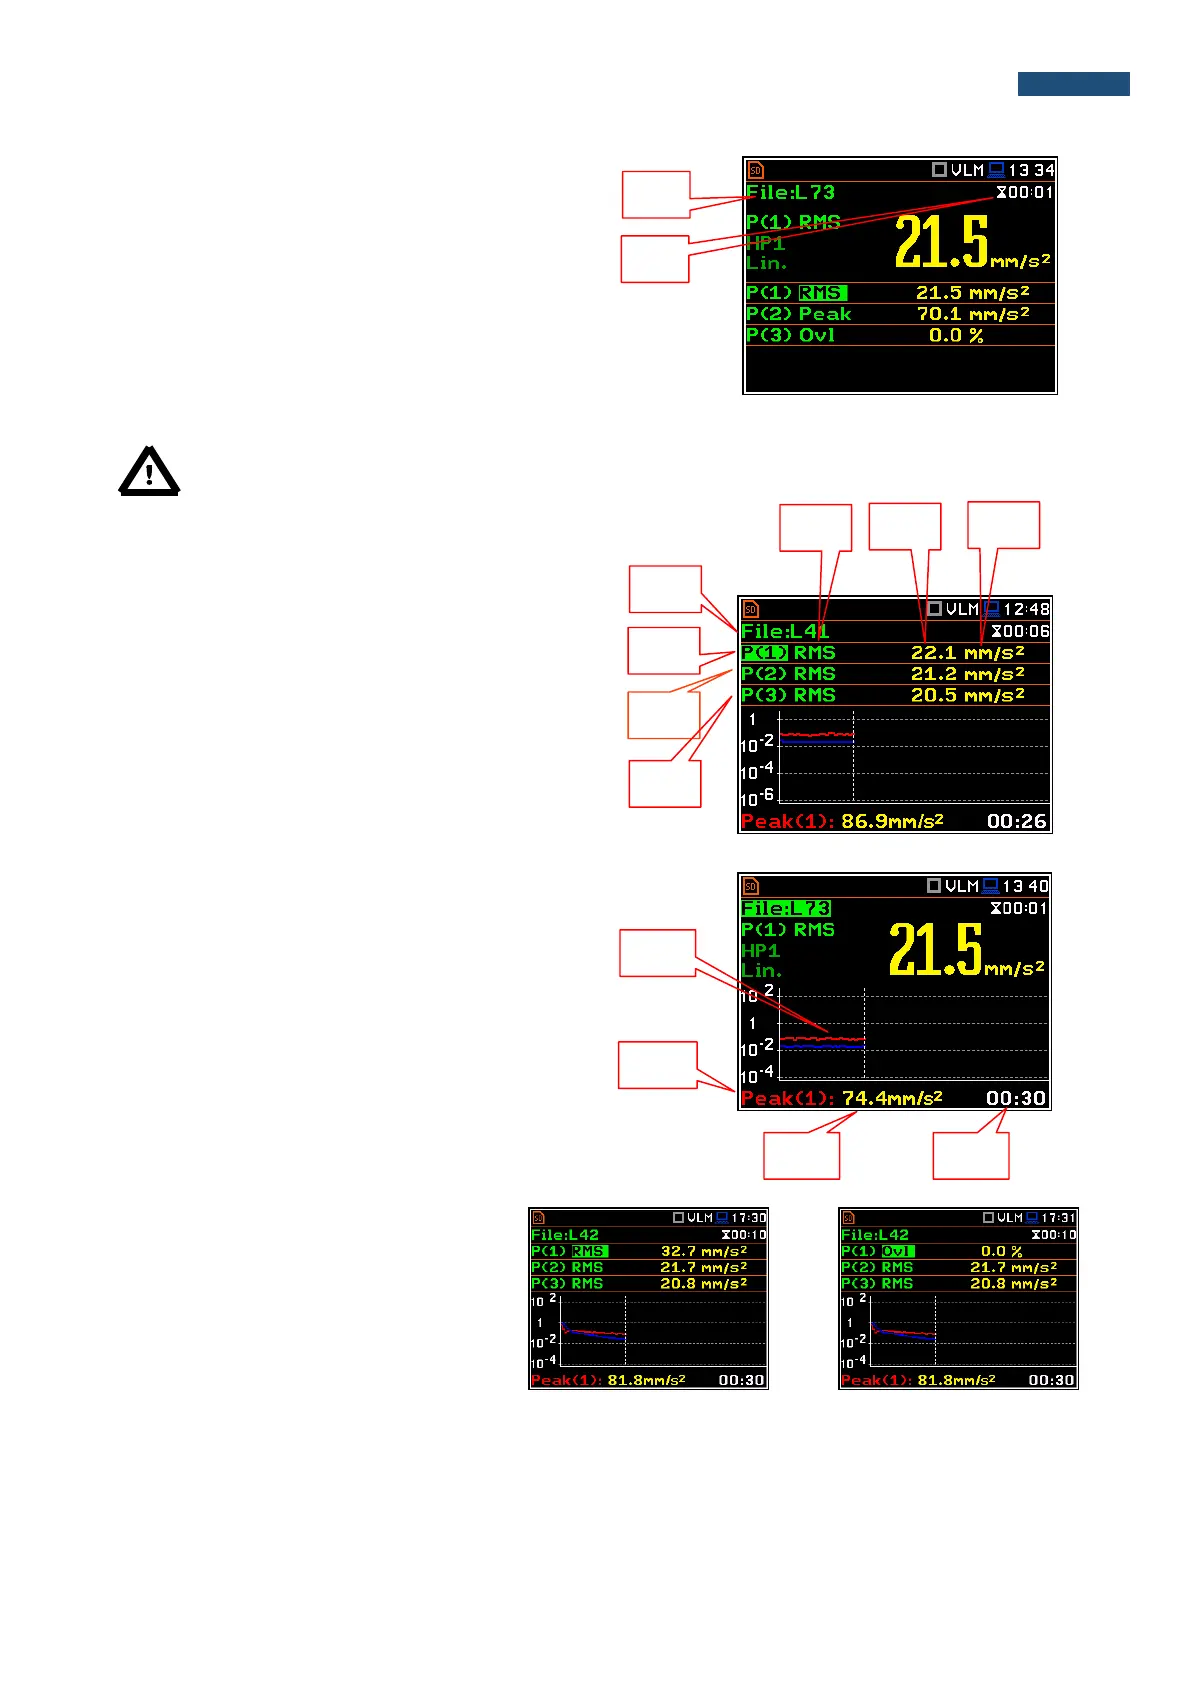
Fields description of the 3 Profiles view
1. File name.
2. Result line for Profile 1.
3. Result line for Profile 2.
4. Result line for Profile 3.
5. Function name: RMS, Ovl, Peak, P–P, MTVV.
6. The value of the measured function.
7. Units of the measured value.
Fields description of the Logger view
1. Logger Plot
2. Function name (Profile number)
3. Function value for cursor position
4. Cursor time position
Changing the field content
The content of some fields can be changed
after pressing the ◄ and ► push-buttons
together with <Alt>.