6–4 Sequence Graphing
82EAB9~1.DOC TI-83 international English Bob Fedorisko Revised: 10/28/05 9:28 AM Printed: 10/28/05 9:28
M Page 4 of 16
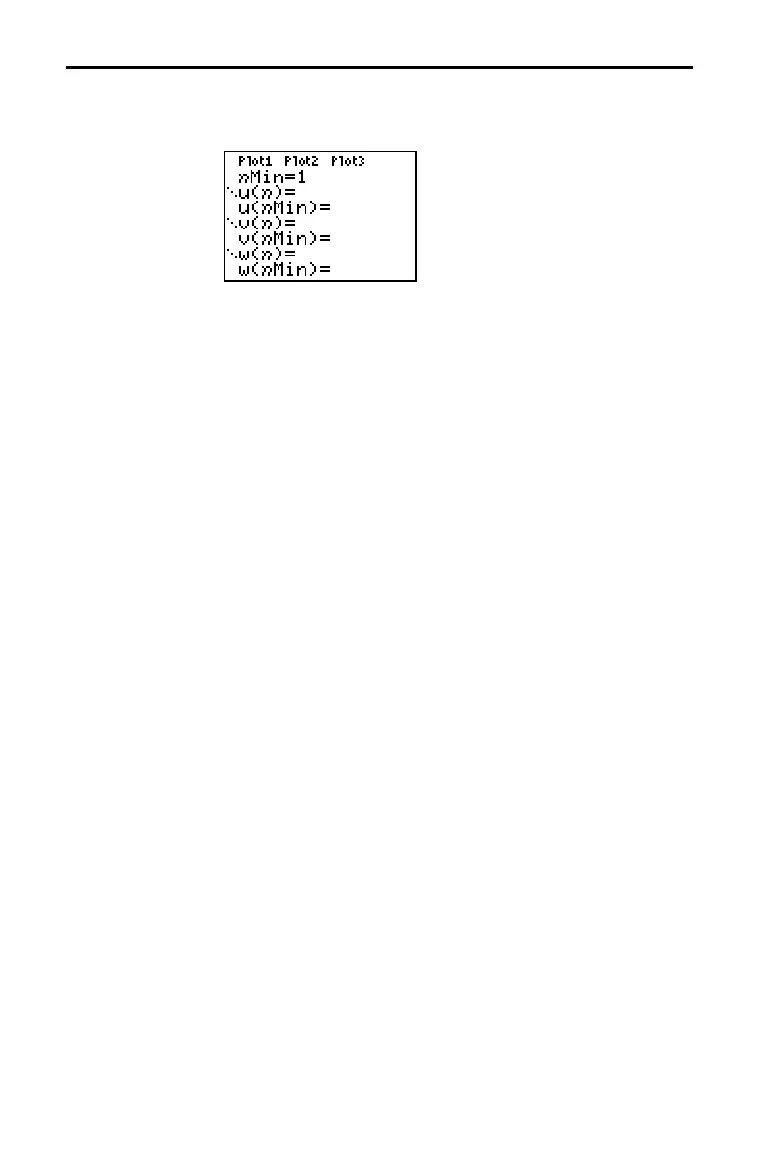
After selecting Seq mode, press o to display the sequence
Y= editor.
In this editor, you can display and enter sequences for u(n), v(n),
and
w(n). Also, you can edit the value for nMin, which is the
sequence window variable that defines the minimum
n value to
evaluate.
The sequence
Y= editor displays the nMin value because of its
relevance to
u(nMin), v(nMin), and w(nMin), which are the
initial values for the sequence equations
u(n), v(n), and w(n),
respectively.
nMin in the Y= editor is the same as nMin in the window editor.
If you enter a new value for
nMin in one editor, the new value
for
nMin is updated in both editors.
Note: Use u(nMin), v(nMin), or w(nMin) only with a recursive
sequence, which requires an initial value.
The icons to the left of u(n), v(n), and w(n) represent the graph
style of each sequence (Chapter 3). The default in
Seq mode is
í (dot), which shows discrete values. Dot, ç (line), and è (thick)
styles are available for sequence graphing. Graph styles are
ignored in
Web format.
The TI-82 STATS graphs only the selected sequence functions.
In the
Y= editor, a sequence function is selected when the =
signs of both u(n)= and u(nMin)= are highlighted.
To change the selection status of a sequence function, move the
cursor onto the
= sign of the function name, and then press
Í. The status is changed for both the sequence function
u(n) and its initial value u(nMin).
Defining and Displaying Sequence Graphs (continued)
Displaying the
Sequence Y=
Editor
Selecting Graph
Styles
Selecting and
Deselecting
Sequence
Functions

 Loading...


