6–14 Sequence Graphing
82EAB9~1.DOC TI-83 international English Bob Fedorisko Revised: 10/28/05 9:28 AM Printed: 10/28/05 9:28
M Page 14 of 16
2. Press y [FORMAT] Í to select Time axes format.
3. Press p and set the variables as shown below.
nMin=0 Xmin=0 Ymin=0
nMax=400 Xmax=400 Ymax=300
PlotStart=1 Xscl=100 Yscl=100
PlotStep=1
4. Press s to graph the sequence.
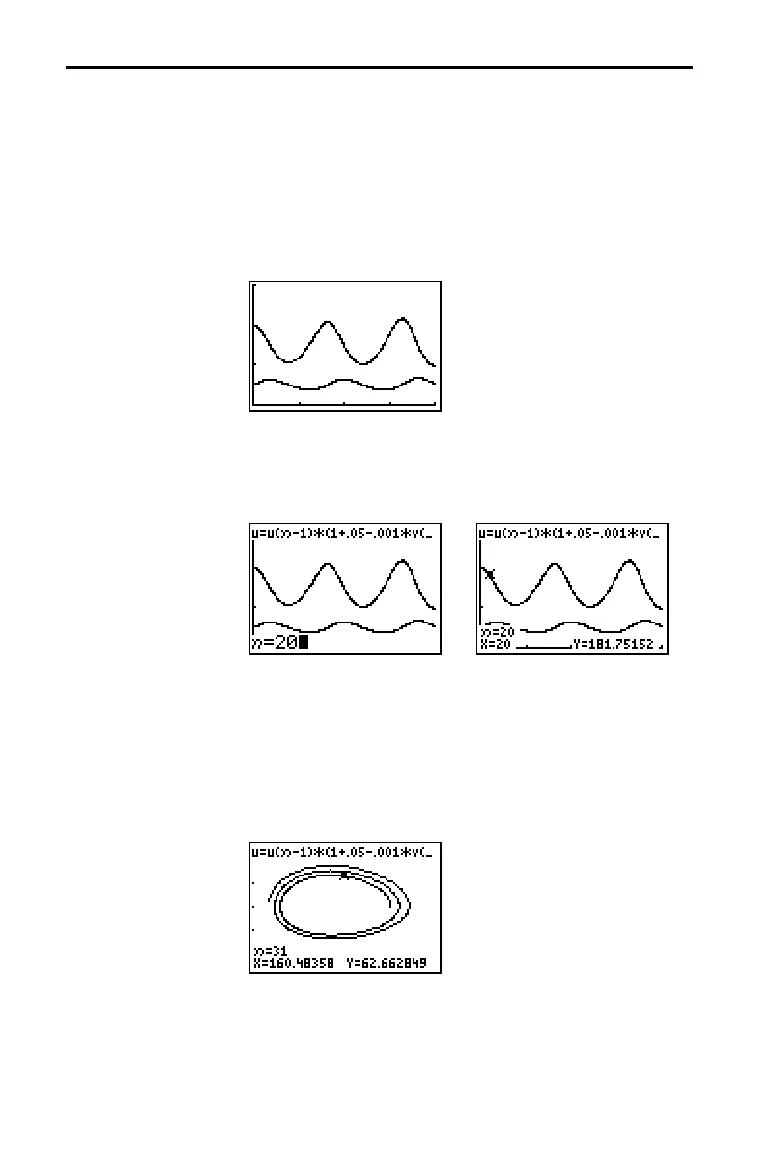
5. Press r ~ to individually trace the number of rabbits
(
u(n)) and wolves (v(n)) over time (n).
Tip: Press a number, and then press Í to jump to a specific n
value (month) while in TRACE.
6. Press y [FORMAT] ~ ~ Í to select uv axes format.
7. Press p and change these variables as shown below.
Xmin=84 Ymin=25
Xmax=237 Ymax=75
Xscl=50 Yscl=10
8. Press r. Trace both the number of rabbits (X) and the
number of wolves (
Y) through 400 generations.
Note: When you press r, the
equation for u is displayed in the
top-left corner. Press } or † to
see the equation for
.
Graphing Phase Plots (continued)
Example:
Predator-Prey
Model
(continued)

 Loading...


