13–36 Inferential Statistics and Distributions
8250FC~1.DOC TI-83 international English Bob Fedorisko Revised: 10/26/05 1:39 PM Printed: 10/27/05 2:57
PM Page 36 of 36
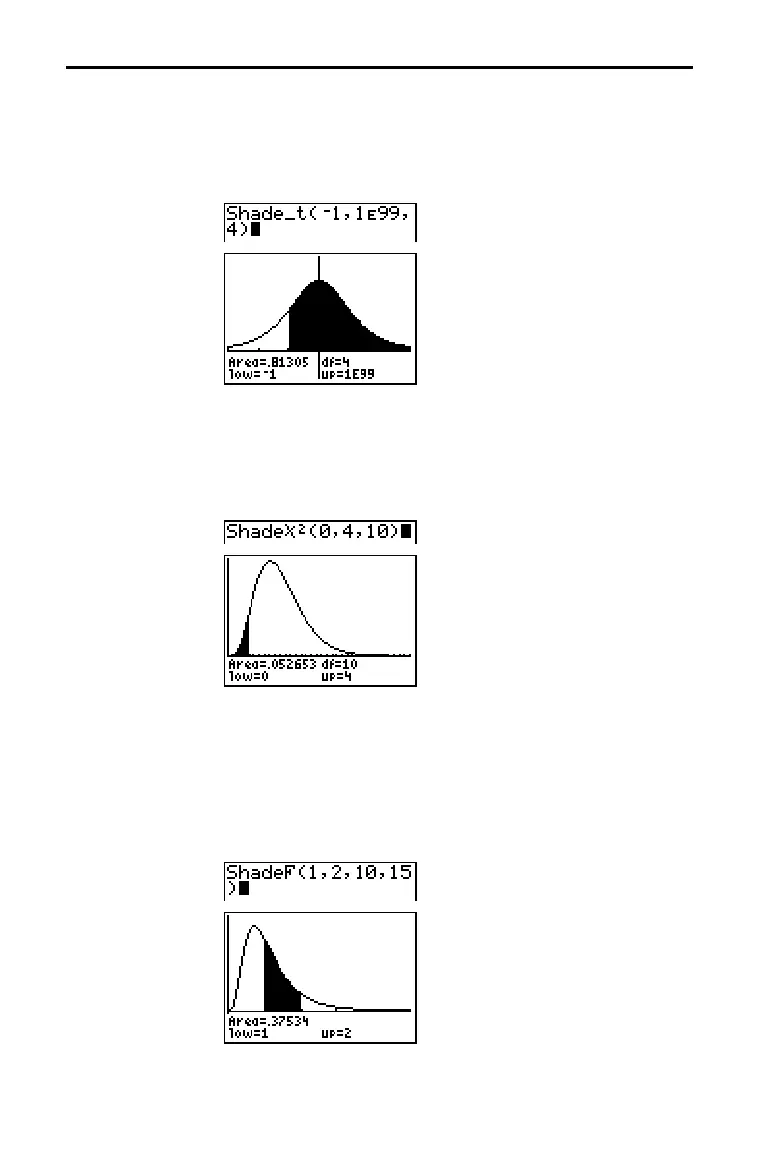
Shade_t( draws the density function for the Student-t
distribution specified by df (degrees of freedom) and shades the
area between lowerbound and upperbound.
Shade_t(lowerbound,upperbound,df)
Note: For this example,
Xmin = L3
Xmax = 3
Ymin = L.15
Ymax = .5
Shadec
2
( draws the density function for the c
2
(chi-square)
distribution specified by df (degrees of freedom) and shades the
area between lowerbound and upperbound.
Shadec
2
(lowerbound,upperbound,df)
Note: For this example,
Xmin = 0
Xmax = 35
Ymin = L.025
Ymax = .1
ShadeÜ
ÜÜ
Ü(
draws the density function for the Û distribution
specified by numerator df (degrees of freedom) and
denominator df and shades the area between lowerbound and
upperbound.
ShadeÜ
ÜÜ
Ü(lowerbound,upperbound,numerator df,
denominator df)
Note: For this example,
Xmin = 0
Xmax = 5
Ymin = L.25
Ymax = .9
Distribution Shading (continued)
Shade_t(
Shadec
2
(
ShadeÜ
ÜÜ
Ü(

 Loading...


