15
Calibrating the MS
Evaluating the Spray Stability
Thermo Scientific TSQ Altis, Quantis, and Fortis Hardware Manual 59
The MS begins to scan and applies high voltage to the spray insert. A real-time mass
spectrum appears in the Tune window.
4. Click Syringe Off to turn on the syringe pump.
A real-time plot of the EMRS mass spectrum appears.
5. Plot the ion chromatogram and relative standard deviation (RSD) graphs as follows:
a. Click the Plot Chromatogram icon, , to open the Plot Chromatogram dialog
box (Figure 27).
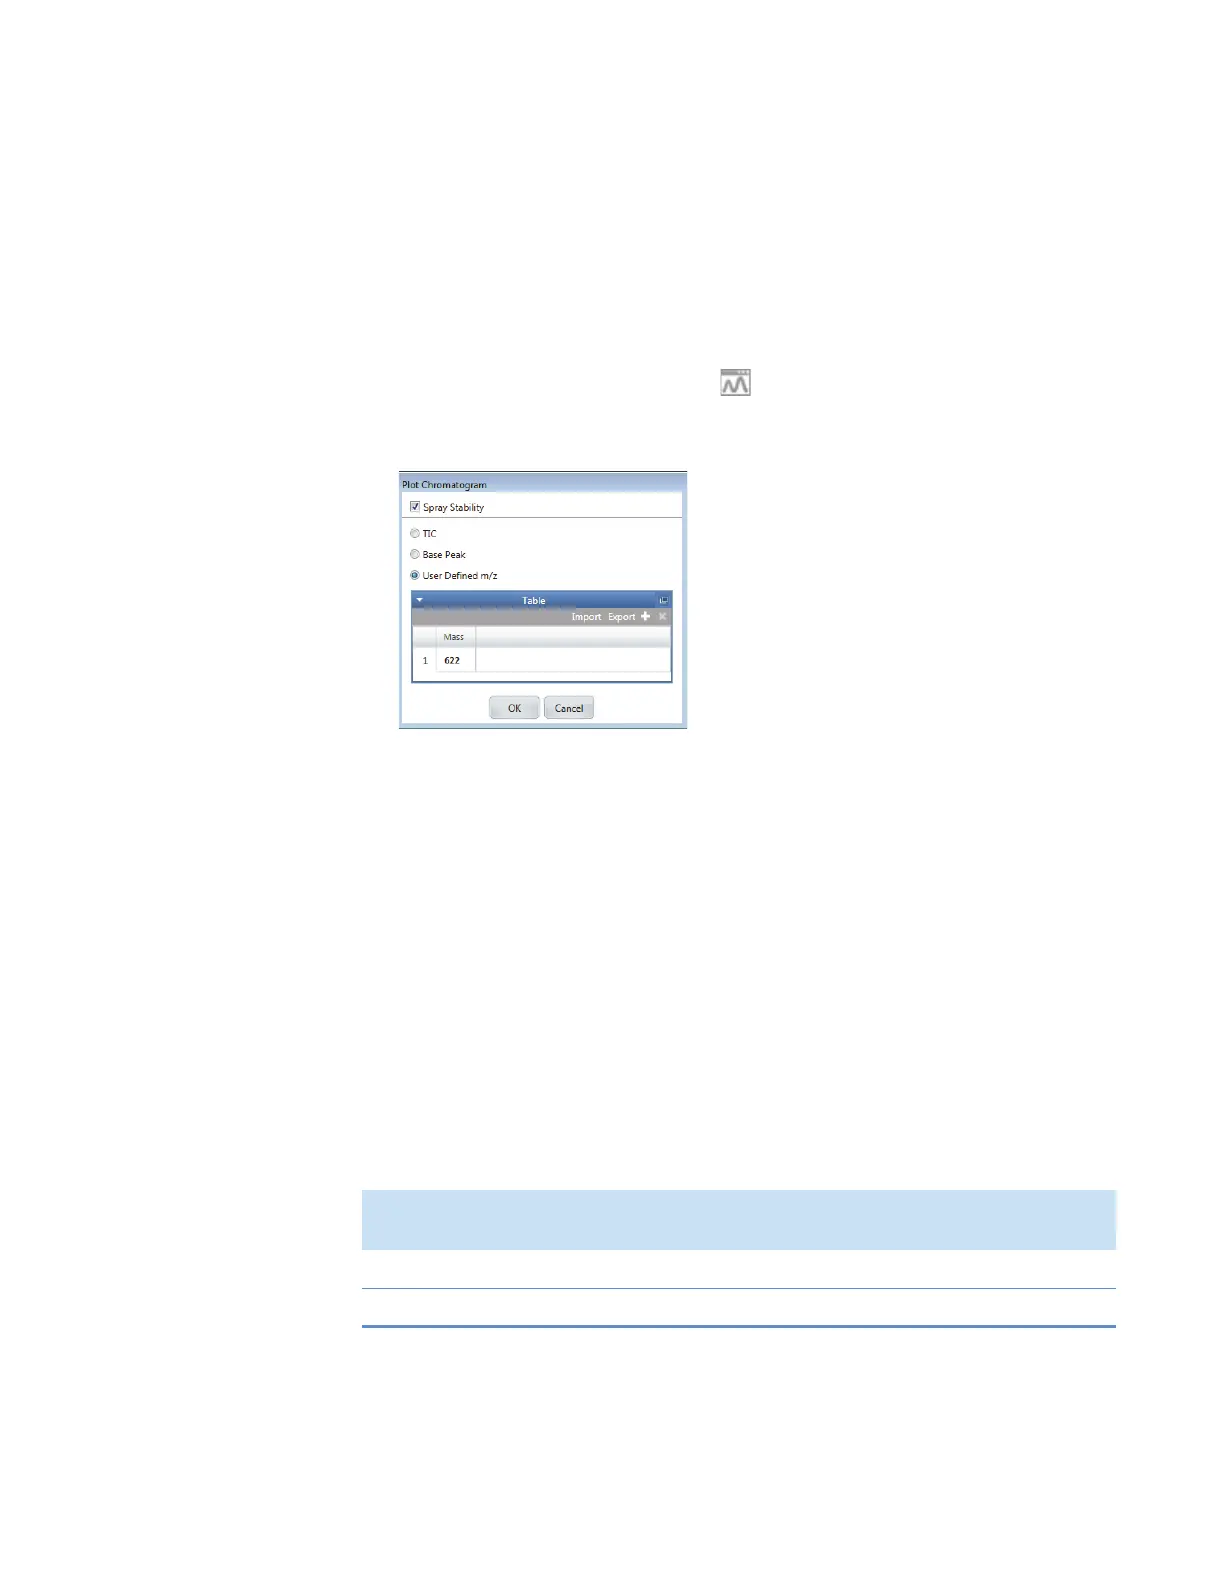
Figure 27. Plot Chromatogram dialog box
b. To monitor the RSD of the target ion current, select the Spray Stability check box.
c. Select the User Defined m/z option, add a table row by clicking the + icon (upper
right of the table), and type 622 (positive mode) or 602 (negative mode) in the Mass
column.
d. To plot the specified chromatogram, click OK.
The Plot Chromatogram tool generates a real-time graph (plot) where you can
observe the signal stability and the effects of changes to various parameters. The tool
also generates a real-time graph of the RSD for a 10 Da-selected ion monitoring
(SIM) scan that is centered around the most abundant mass-to-charge ratio (m/z) in
the current spectrum.
6. Observe the RSD graph, and review the signal stability rating and %RSD value.
Table 1 2 lists the criteria for a stable spray in either positive or negative ion polarity mode.
z
7. If the signal stability rating is poor or the %RSD value is above the threshold, optimize
the API source parameters.
a. Adjust the sheath gas plus or minus 1 unit.
Table 12. Recommended %RSD values and ratings for the calibration solutions
Ion polarity mode
Acceptable signal
stability rating
Maximum %RSD
(threshold)
Positive Excellent or Good 15
Negative Excellent or Good 15
 Loading...