Thermo Scientific TSQ Altis, Quantis, and Fortis Hardware Manual 79
Data Types
You can acquire data in profile or centriod mode and you can detect positive and negative ion.
Profile and Centroid Data
You can acquire and display mass spectral data (intensity versus m/z) as “profile data,” or as
“centroid data.”
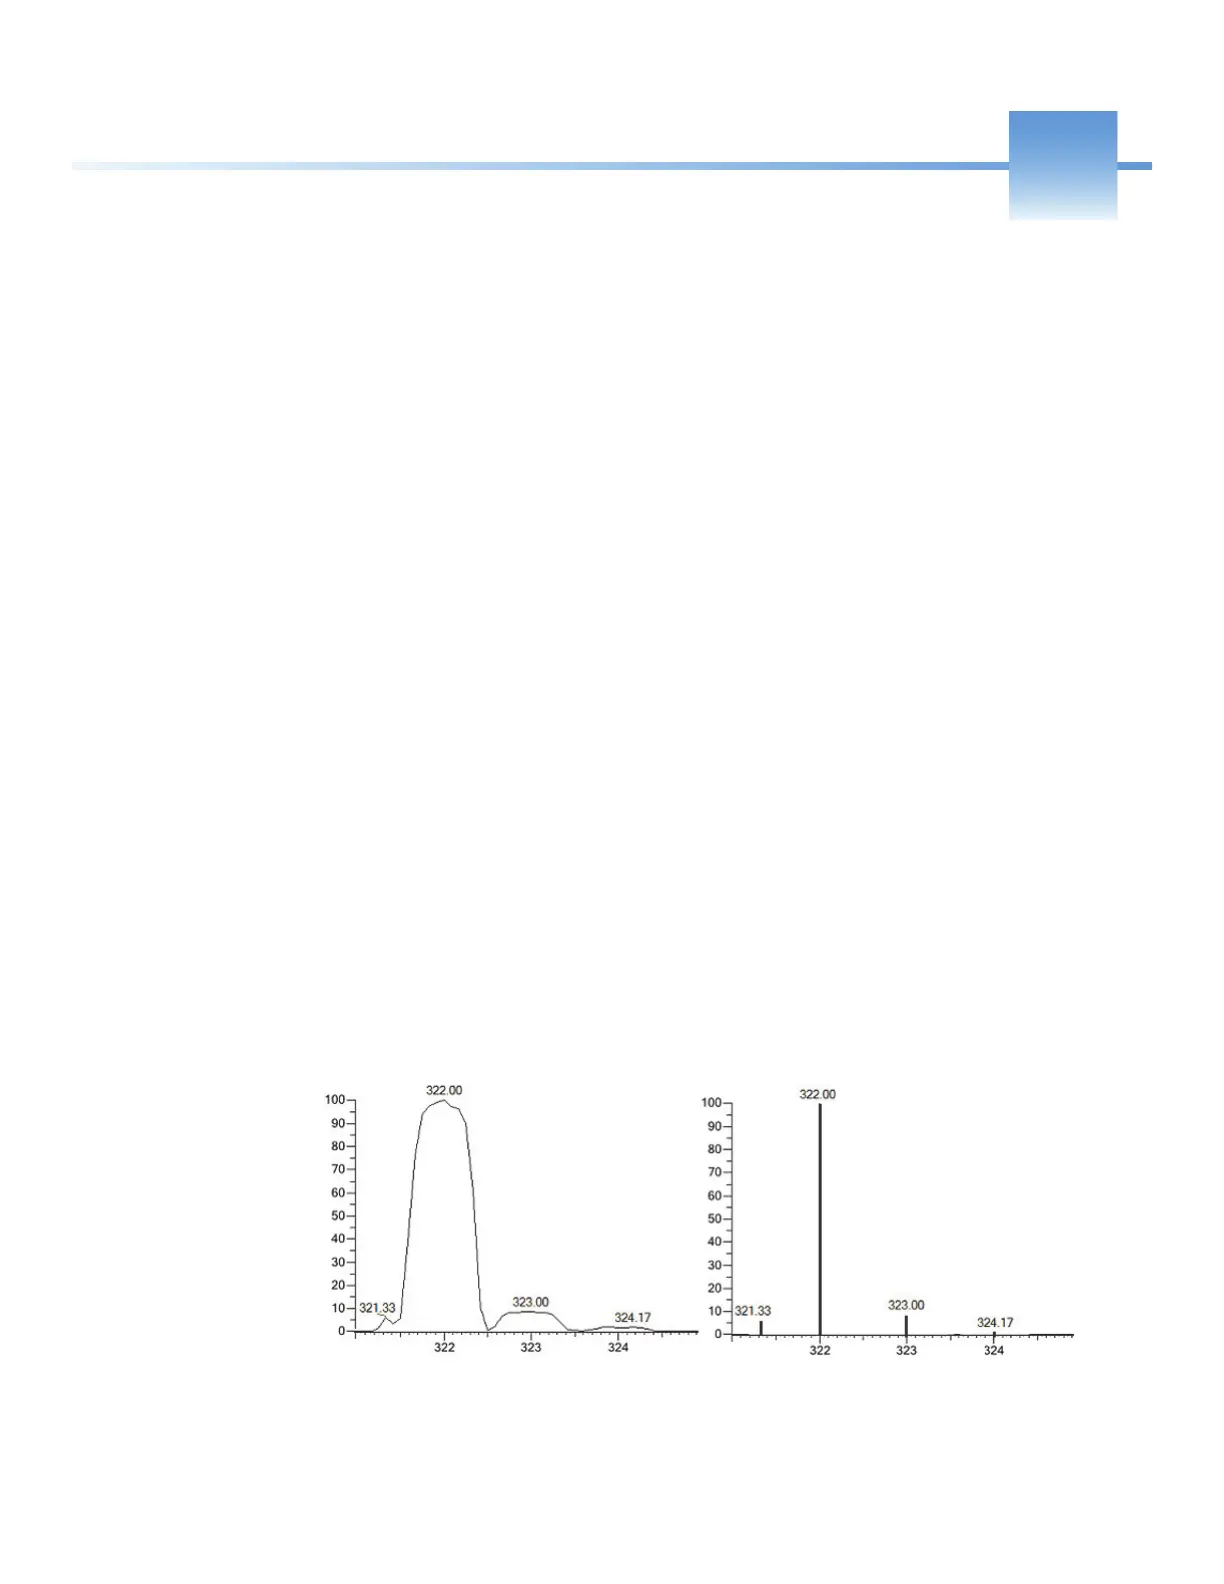
•Profile data—With profile data, you see the inherent shape of the peaks in the mass
spectrum. The mass spectrum divides each atomic mass unit into several sampling
intervals. The intensity of the ion current is determined at each sampling interval. The
intensity at each sampling interval is displayed with the intensities connected by a
continuous line. Profile data is a good way to see the isotopic distribution, especially for
higher charged ions.
• Centroid data—With centroid data, you see the mass spectrum as a bar graph. Centroid
gives you a reliable readback of the measured m/z. This scan data type sums the intensities
of each set of sampling intervals. This sum is displayed versus the integral center of mass
of the many sampling intervals. An advantage of centroid data it that it requires about
one-tenth the computer disk space of profile data.
When you do SRM methods, the data is automatically collected in centroid mode.
Figure 41. Examples of Profile (left) and Centroid (right) Data
 Loading...