The Main Menu
158
Access Graphs by calling up the Main Menu from the Main
Screen (dial the control knob until the MENU box on the lower
right corner is highlighted in blue, then press the control knob),
then use the control knob to select and click Show Graphs. If
the iVent
201
display is split between Graphs and something else
-- Trends, Loops or Mechanics, then it will return to display
only Graphs.
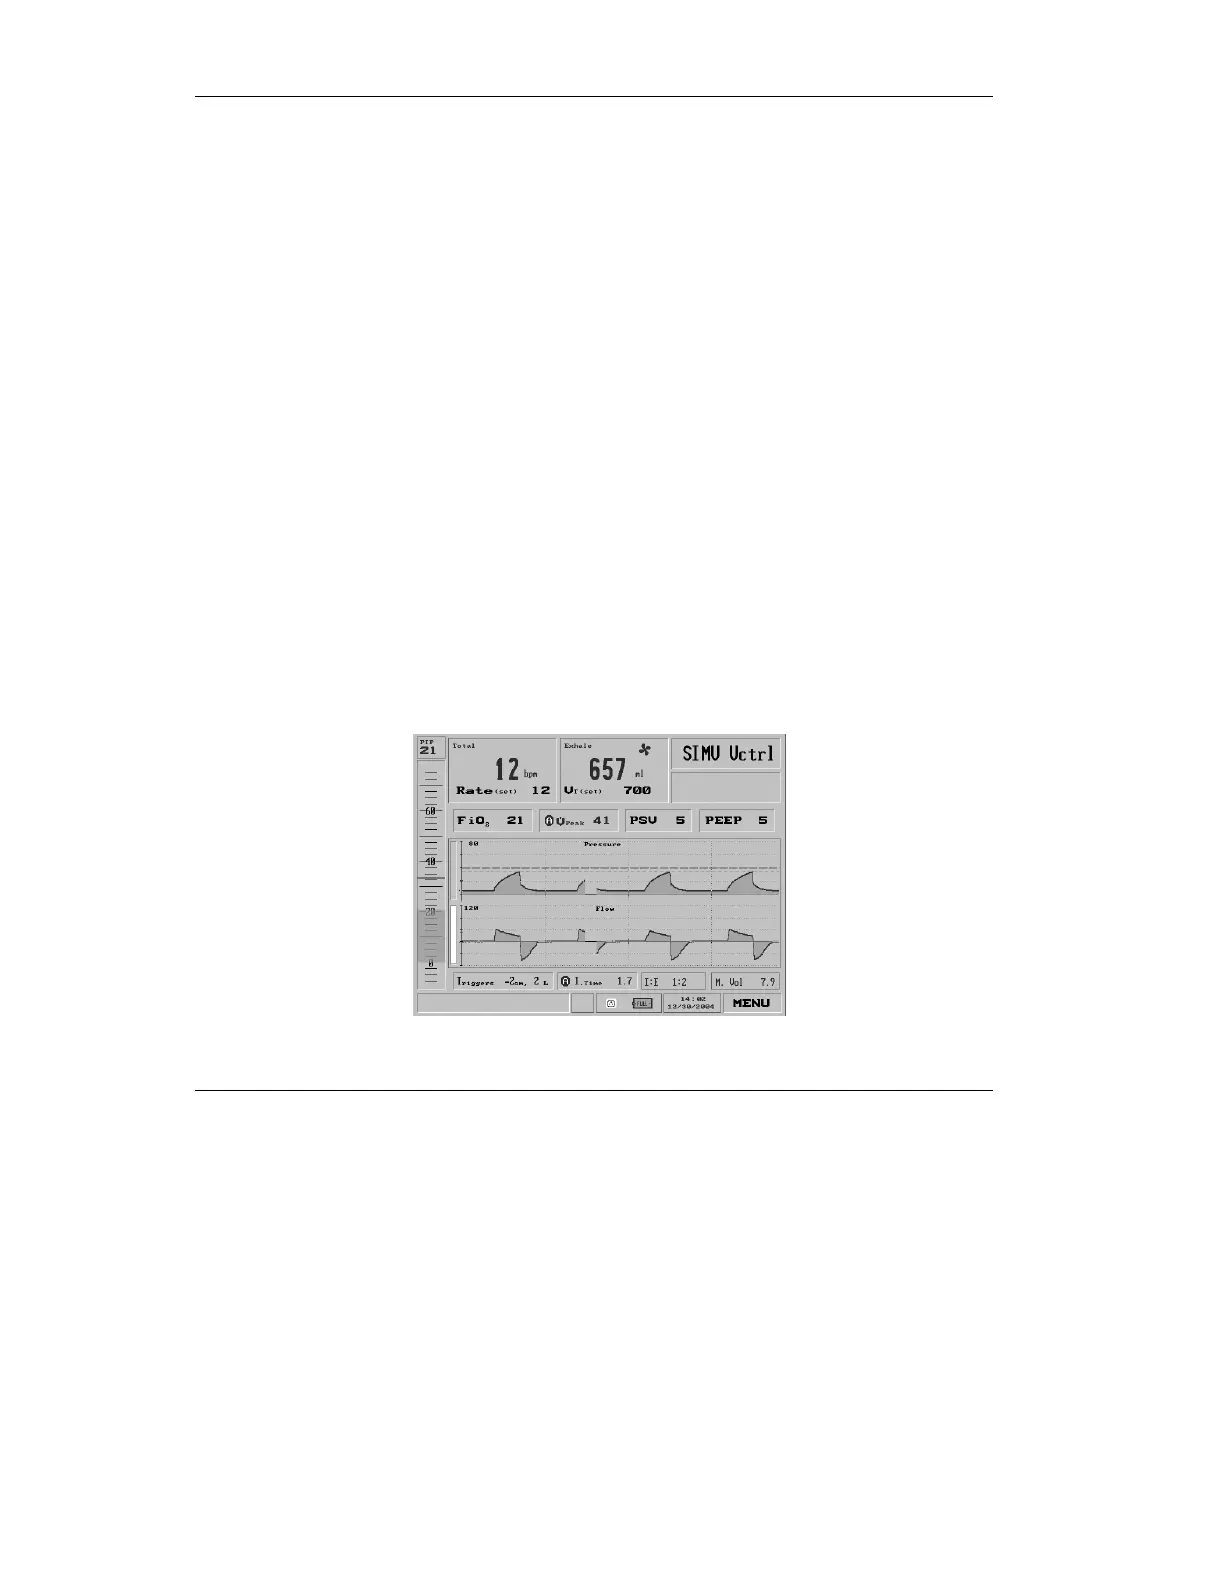
The Graphs view displays Pressure and Flow waveforms. The
zero coordinate is colored blue. The pressure limit is displayed
as a broken green line. The high pressure alarm setting is
shown as a broken red line.
NOTE: Select is not active.
4.5.1 Browse Waveforms
You may browse forward or backward to examine the patient
ventilation history, up to 7.2 hours. First, choose either the
Pressure waveform or the Flow waveform by rotating the dial
so that the Select bar of either is chosen.
Figure 4.47 The Flow waveform selected