ViewRay Inc. MRIdian® system L-0009 Release 4.5 133
Chapter 5: Prescription and Patient Management
5.14.9 Viewing the Delivery Report
The delivery report includes the prescription, plan settings, treatment and patient IDs, beam
delivery times, one delivery screen is automatically taken and added. Additional screens can
be captured and added by Pressing the Print Screen key.
To get a PDF of a Delivery Record:
Click > PDF Report loc
ated at the bottom of the screen. See Viewing Delivery Records on
page 411
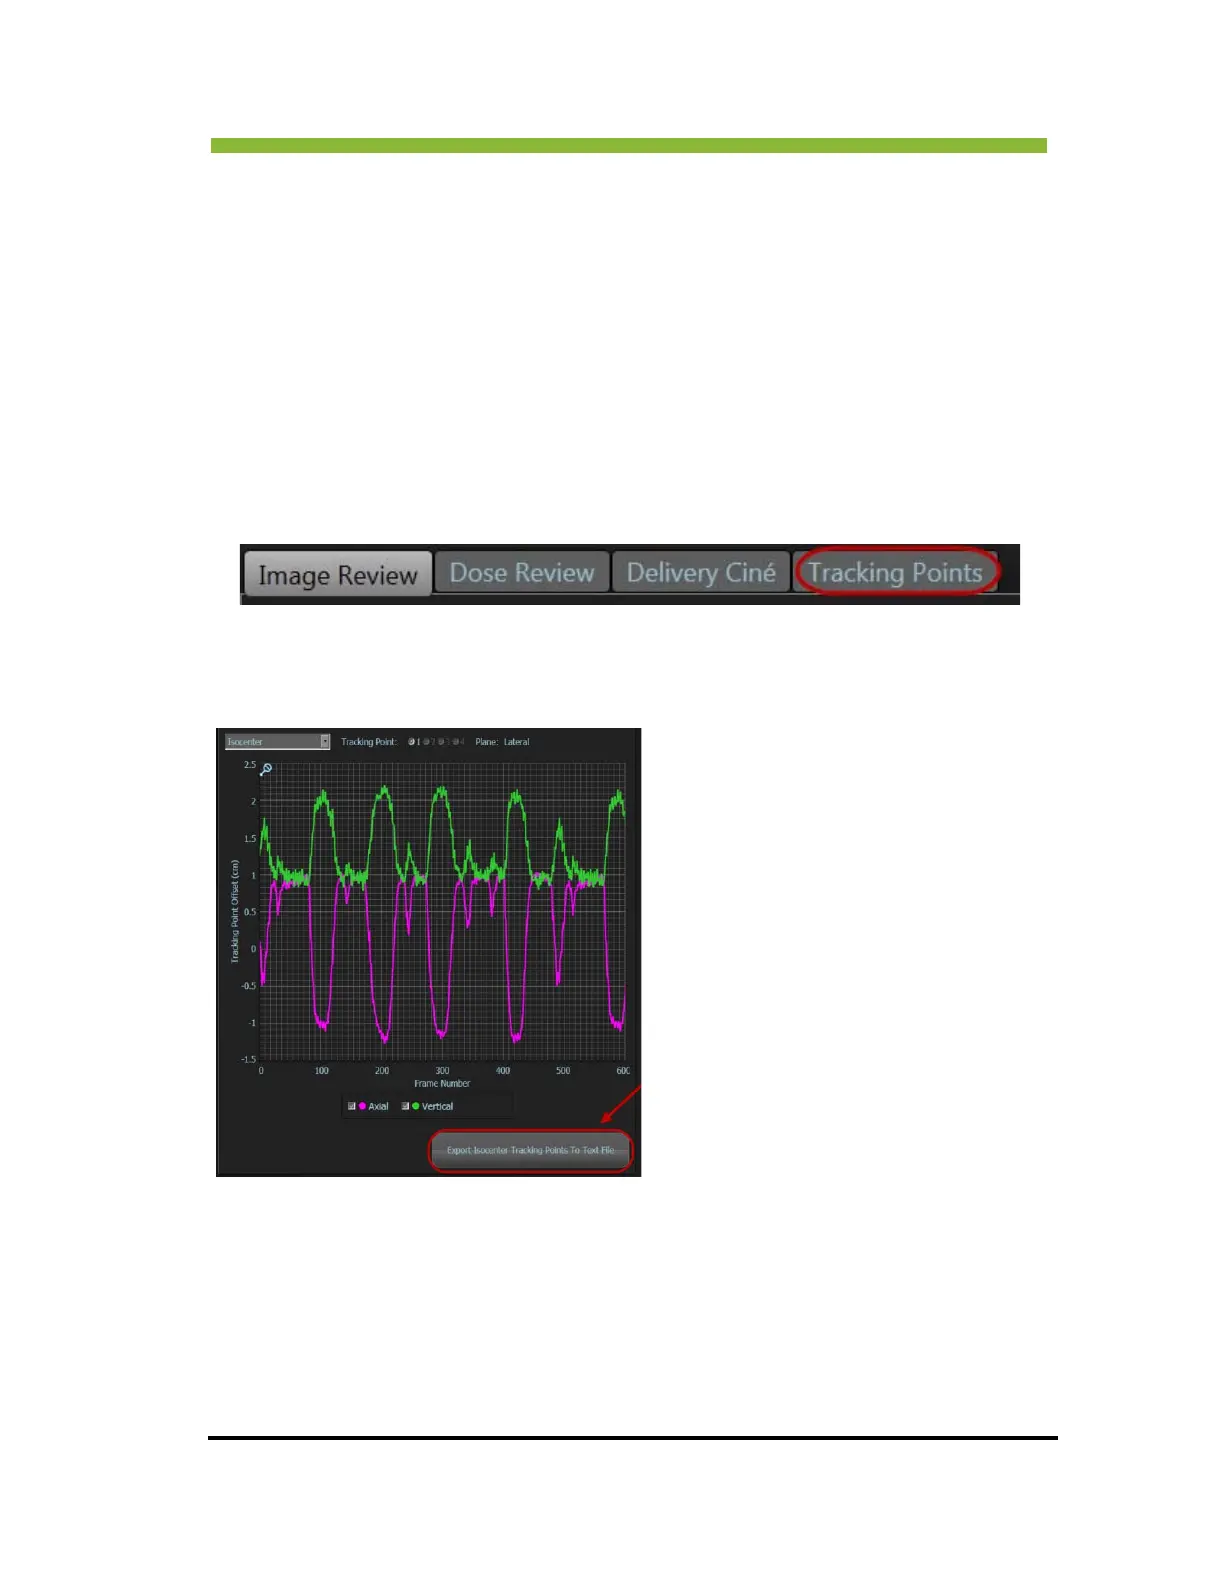
5.14.10 Viewing the Tracking Points Chart
If tracking points were set up in the plan, the results can be viewed during fraction review.
From the Fraction Review screen Click > Tracking Points. See Using Tracking Points on
page 363
The Tracking Point chart will open.
The amplitude of the wave is the distance
the
point moved in a given frame. The
horizontal axis represents time. Each frame
comprises 0.25 second. You can zoom in on
the chart by clicking and dragging the
mouse. You can export the tracking point
data in text format by clicking the button in
the lower right corner.
Pink waves are axial. Green are vertical.
The exported text file will be in the following format:
Line 1 - Number of Tracking Points (N)
Next N Lines-Each tracking point's ID number
<space> Original X Location <space>
Original Y Location <space> Original Z Location
Next Line - -9999 -9999 -9999 (ignore)
Several Blocks of N+1 Lines - each is an entry for that time frame. Blank line
• Shifts for Point 1: X <space> Y <space> Z
• Shifts for Point 2: X <space> Y <space> Z
• Shifts for Point N: X <space> Y <space> Z
Any line with -9999 indicates an error calculating the shift f
or that point.